Section7 Software Services
Introduction
A total of 1,694 respondents answered the qualifying question for this section. The data includes service providers, businesses, agencies and hobby users that use drone software. The confidence level for this portion of the survey is 95% ± 2.38. However, due to the way this section heavily relies on logic flows to direct unique questions to different respondents, play close attention to the sample size data on each chart, as it fluctuates.
As our qualifying question for this section, we asked: “What type of software does your organization use to support its drone operations”. Respondents were able to answer we don’t use any or conversely they had four different options (and could choose more than one): (1) flight control software during flight, (2) drone operations management software, (3) Insights / analytics software and (4) video or photo editing software. For respondents who didn’t use any software, they skipped this section entirely and went to our final question.
For those remaining, we designed separate paths for those who selected insights / analytics software and/or drone operations management software for some additional questions. While we were interested to know if respondents used video or photo editing software or flight control software during flight, we didn’t have any follow-up questions specifically about these software categories.
List of Figures
Software Types Used and Attachment Rates
- 7.1: Software Type(s) Used
Software Type Preferences and Overall Market Share
Data Access and Consumption Preferences
7.4: Software Consumption Preferences
7.5: Software Consumption Preferences by Sector
7.6: Stakeholders with Access to Drone Data
Insights / Analytics Software
7.7: Insights / Analytics Brand Market Share
7.8: Insights / Analytics Brand Market Share by Sector
7.9: Insights / Analytics Category Maturity
7.10: Insights / Analytics Primary Purchasing Factors
Drone Operations Management Software
List of Tables
7.1 Software Type(s) Used and Attachment Rates
We began by asking all survey respondents what type of software they use to support their drone operations as both a way to qualify them for the larger software section and to understand what software is being used by which users. Respondents could select multiple different software types. We removed respondents that do not use any of these software types and displayed the results in Figure 7.1.
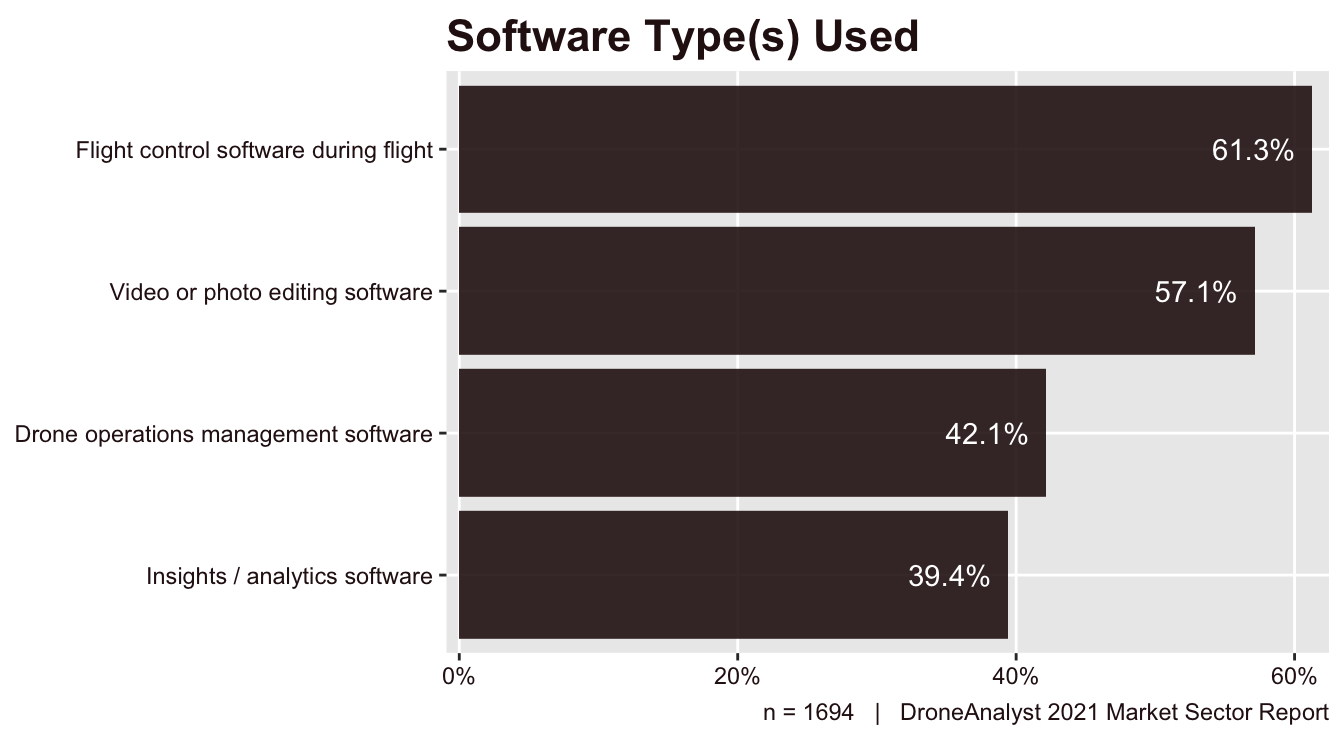
Figure 7.1: Software Type(s) Used
As nearly all drone applications today involve controlled flight and the collection of photos or videos, we were not surprised to see that nearly 60% of respondents selected flight control and/or video/photo editing software. Drone operations management platform has slightly more responses than insights / analytics software, a reversal from 2020. Despite this reversal, both of these advanced software types were deployed more frequently than last year, increasing roughly 6 points each.
If we break this down further into the respondent’s role (determined by the survey section(s) they qualified for), we can better understand how software attachment rates to specific software categories change. We break out this data in the table below, and note that there is overlap in responses between categories (you can refer to Figure 1.2 for more information and definitions).
| Software Used | Business / Agency Users | Drone Buyers | Service Providers |
|---|---|---|---|
| Drone operations management software | 47.4% | 45.9% | 46.0% |
| Insights / analytics software | 46.9% | 41.7% | 46.8% |
| Flight control software during flight | 60.2% | 60.7% | 65.7% |
| Video or photo editing software | 52.8% | 55.4% | 59.2% |
| DroneAnalyst 2021 Market Sector Report |
As is to be expected, business and agency users were more likely to be using a drone operations management and insights / analytics software, albeit at only slightly higher rates.
Additionally this year we broke down attachment rates even further among business and agency users. This is to provide a better sense for how different software types are used across key customer types.
| Business/Agency Sector | Drone operations management software | Insights / analytics software |
|---|---|---|
| AEC, Surveying & Mapping | 40.1% | 63.6% |
| Agriculture | 39.1% | 53.6% |
| News & Entertainment | 45.0% | 27.5% |
| Public Safety | 51.4% | 29.5% |
| Utilities | 62.1% | 54.4% |
| Real Estate & Insurance | 31.9% | 8.3% |
| Analytics & Consulting | 61.3% | 57.0% |
| DroneAnalyst 2021 Market Sector Report |
There is a lot to dive in here. First we see a few key sectors with a preference for drone operations management software. These either have a lessened need for more sophisticated analytics sharing (public safety, news & entertainment, real estate) or have larger needs for fleet management and coordination (utilities).
Conversely, we see a larger gap between those who preferred insights / analytics over drone operations software. This is particularly noticeable among customers in the AEC and agriculture sectors, where drones are primarily used to create some form of analytics deliverable.
7.2 Software Type Preferences and Overall Market Share
For respondents who used both drone operations management and insights / analytics software, we added an additional question around their software category preferences. This was added as we have increasingly seen software platforms like DroneDeploy bridge the gap between these two categories, and wanted to understand which of these platforms was most critical to determining software purchasing decisions.
The question asked specifically about which software category was most core to their operations. Respondents could select that they used a single software for both functions, or a specific category over the other. The findings are broken down below in Figure 7.2.
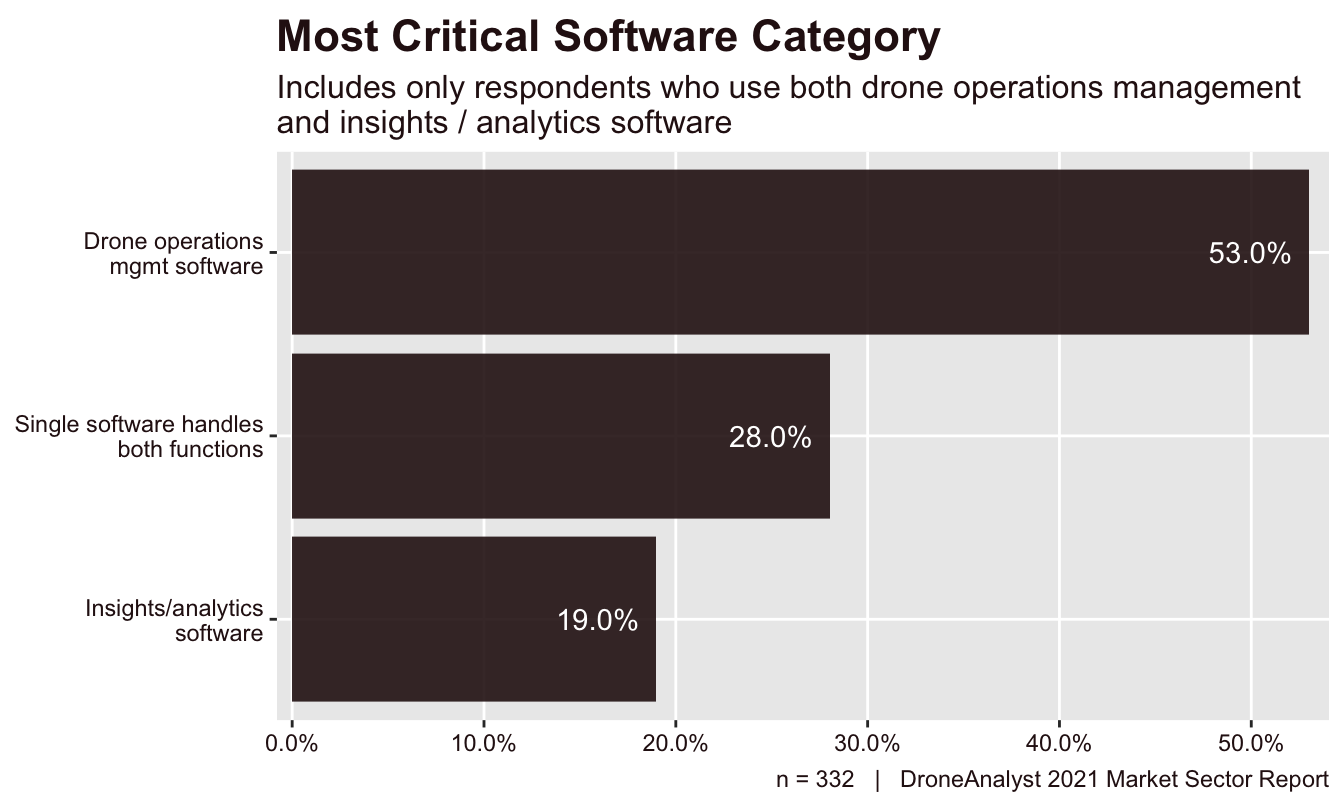
Figure 7.2: Most Critical Software Category
Broadly speaking, we saw that the majority of respondents saw drone operations management as most core to their operations. This makes sense when we consider that drone operations management software is used slighly more frequently across the broad. Additionally, among the most frequent users of these software (refer to Table 7.2), like in the utilities and analytics sector, respondents used drone operations management software more frequently.
It is notable, however, that we see (what we categorize as) Insights / Analytics brands as dominating the overall software market, with several brands being chosen in both categories. This is due to the market being young and customers either not identifying software categories as cleanly as we describe it, or - the more likely case - that most software platforms are bridging the gap between these categories.
To better understand the leading software brands in the marketplace, while ignoring any errors brought up by our software categorizations, we first looked at all unique software purchases across all categories. Through this view, we can get a better view of the most selected software platforms.
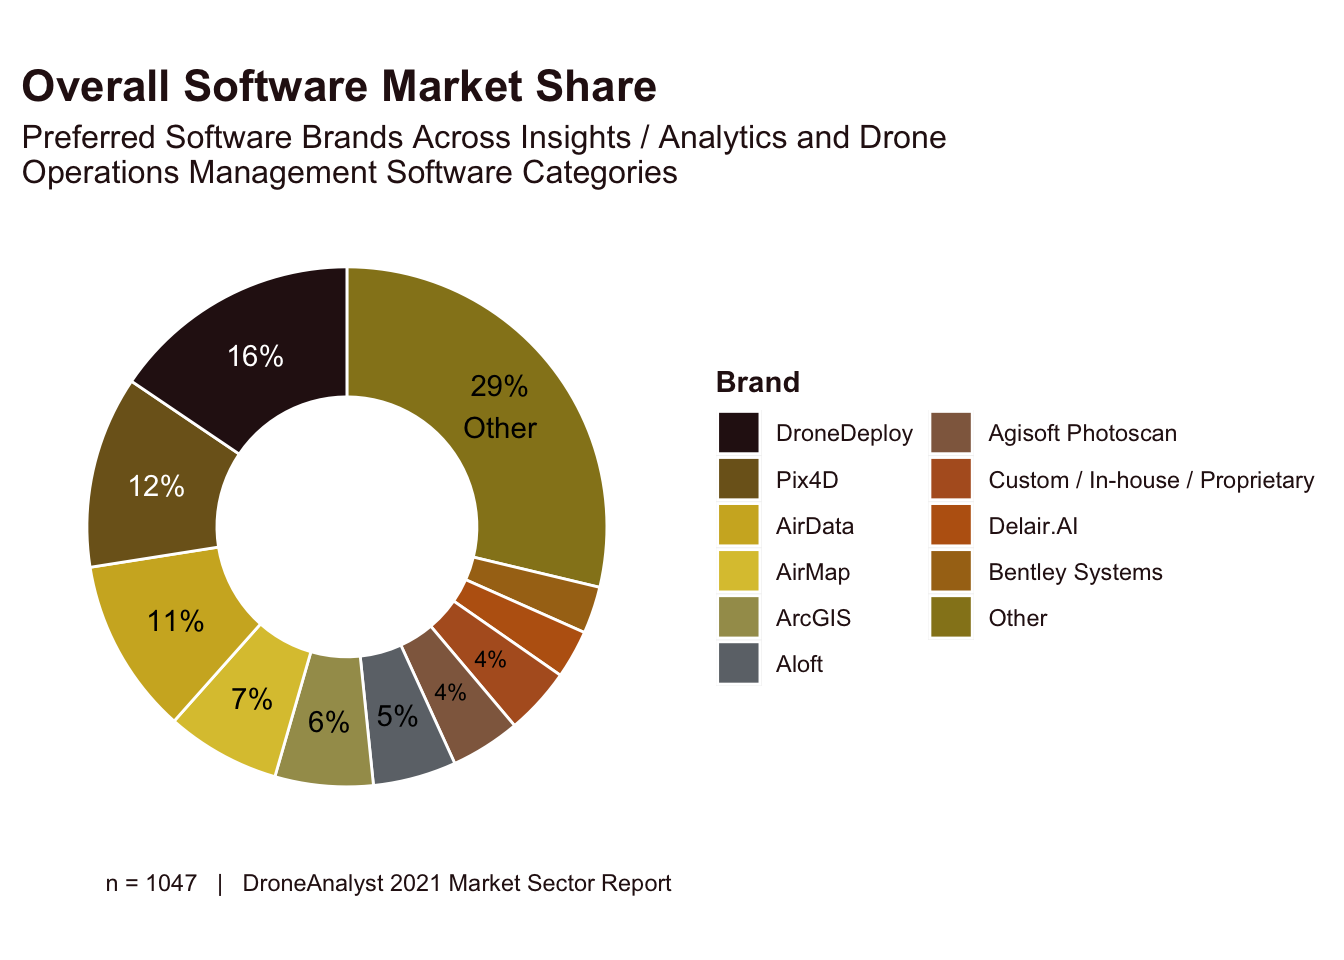
Figure 7.3: Overall Software Market Share
This year we saw an increasing amount of consolidation in the software market. Whereas our leading two brands made up just 20% of the market in 2020, they now make up 28% today. This is largely due to the growth of DroneDeploy’s share, jumping 6 points to take the lead over Pix4D. To look back at our question about software categories, these two firms are both what we would categorize as Insights / Analytics software first, but DroneDeploy has also been chosen as a drone operations software as well. This makes sense as they have increasingly built out functionality across the entire drone software stack.
These two Insights / Analytics firms are followed closely by drone operations focused software, AirData and AirMap. We further explore market shares across each specific software categories later in the report.
7.3 Data Access and Consumption Preferences
We asked respondents about their preferred way to pay for the drone apps and software services they use. The results can be found in Figure 7.4.
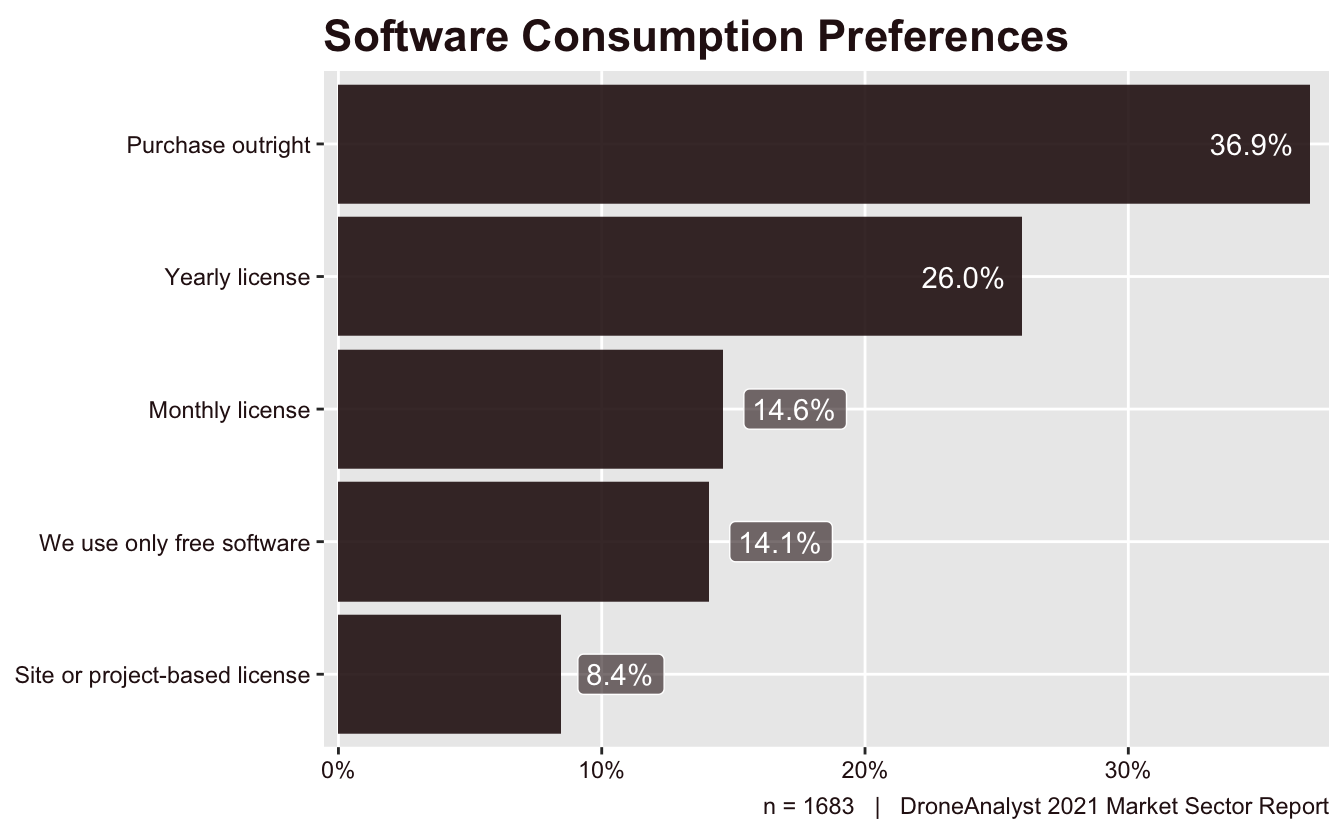
Figure 7.4: Software Consumption Preferences
Purchase outright continues to be the leading preference at over a third (37%) of total respondents. Yearly licenses have seen a steady increase of roughly 3 points each year we’ve conducted this survey, and the preference for free software has dropped off significantly, from 21% in 2020 to just 14% today.
Similarly to the type of software used, we see shifts in the data when we categorize by the sector of business and agency users. We display the proportion of consumption preferences for each sector of business and agency users in Figure 7.5.
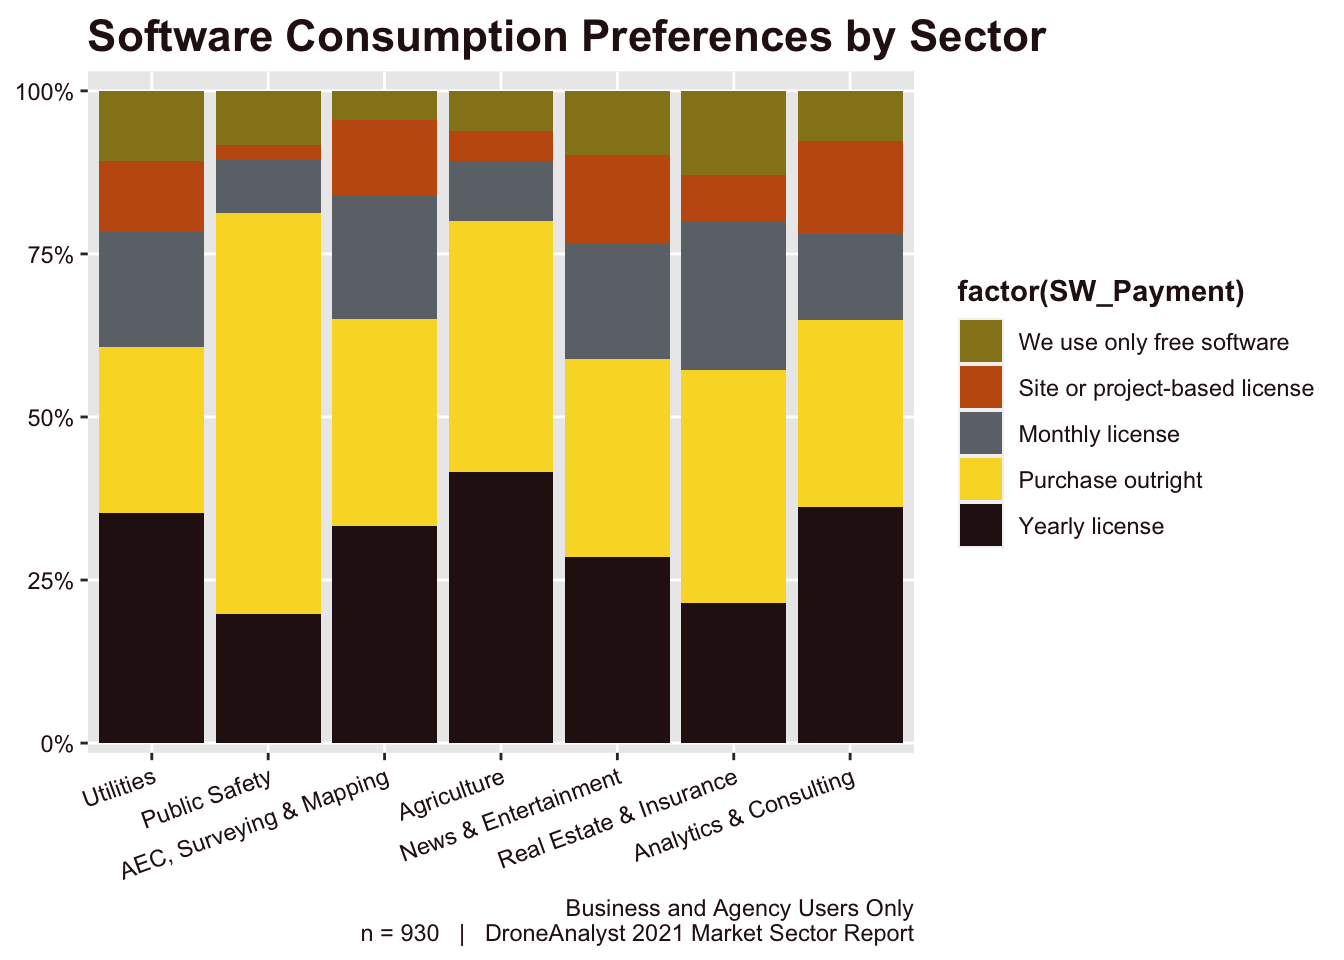
Figure 7.5: Software Consumption Preferences by Sector
This view is critical to understanding what type of businesses are willing to accept each payment scheme. The noticeable outlier here is public agency preferences for purchasing software outright. This makes sense considering their purchase process.
Next, we asked respondents which stakeholders have access to their drone data to understand how software may be used to share drone data and which parties see value from access to this data. We visualize this in Figure 7.6.
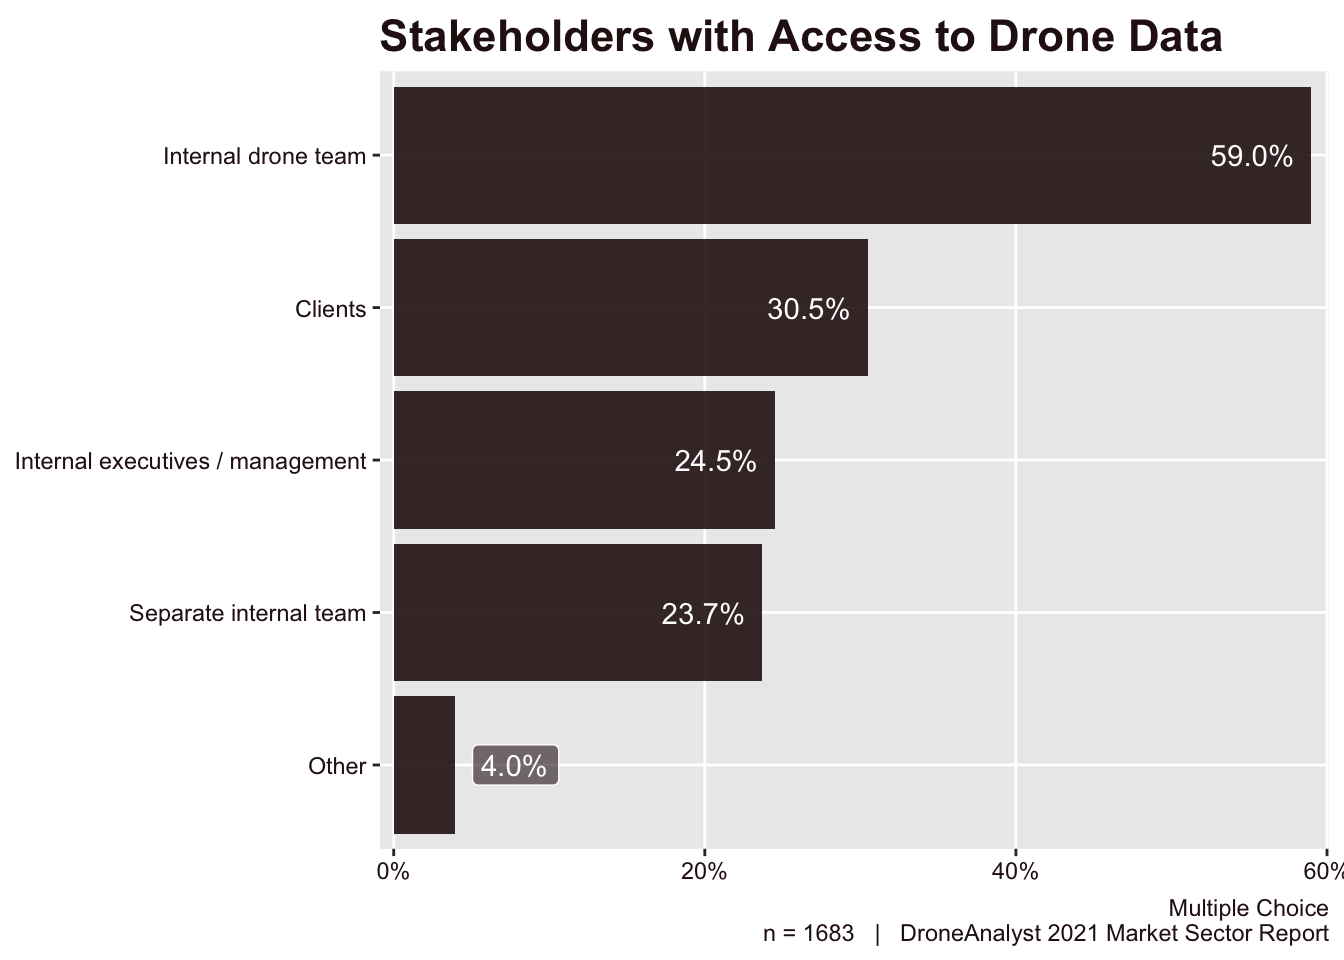
Figure 7.6: Stakeholders with Access to Drone Data
Most often drone teams are sharing data amongst their drone team, making up nearly 60% of respondents. This is followed by clients (we specified in the survey that if the respondent was a public agency, this meant their citizenry) with 31% of responses.
We saw large growth in users sharing drone data with internal executives (up 10 points) and separate internal team (up 14 points). This reflects a large demographic increase in business and agency users which are most likely to share drone data in this way (see Figure 1.2).
7.4 Insights / Analytics Software
For users of Insights / Analytics software, we asked them several follow-up questions to better understand the software brand that they use, the maturity of the software they used and the features that drive them to select one software over another.
For our first question on which software they use, we listed 16 brands for respondents to choose from, with an additional Custom software and Other option where users could write in a brand not listed. Their responses are displayed in Figure 7.7.
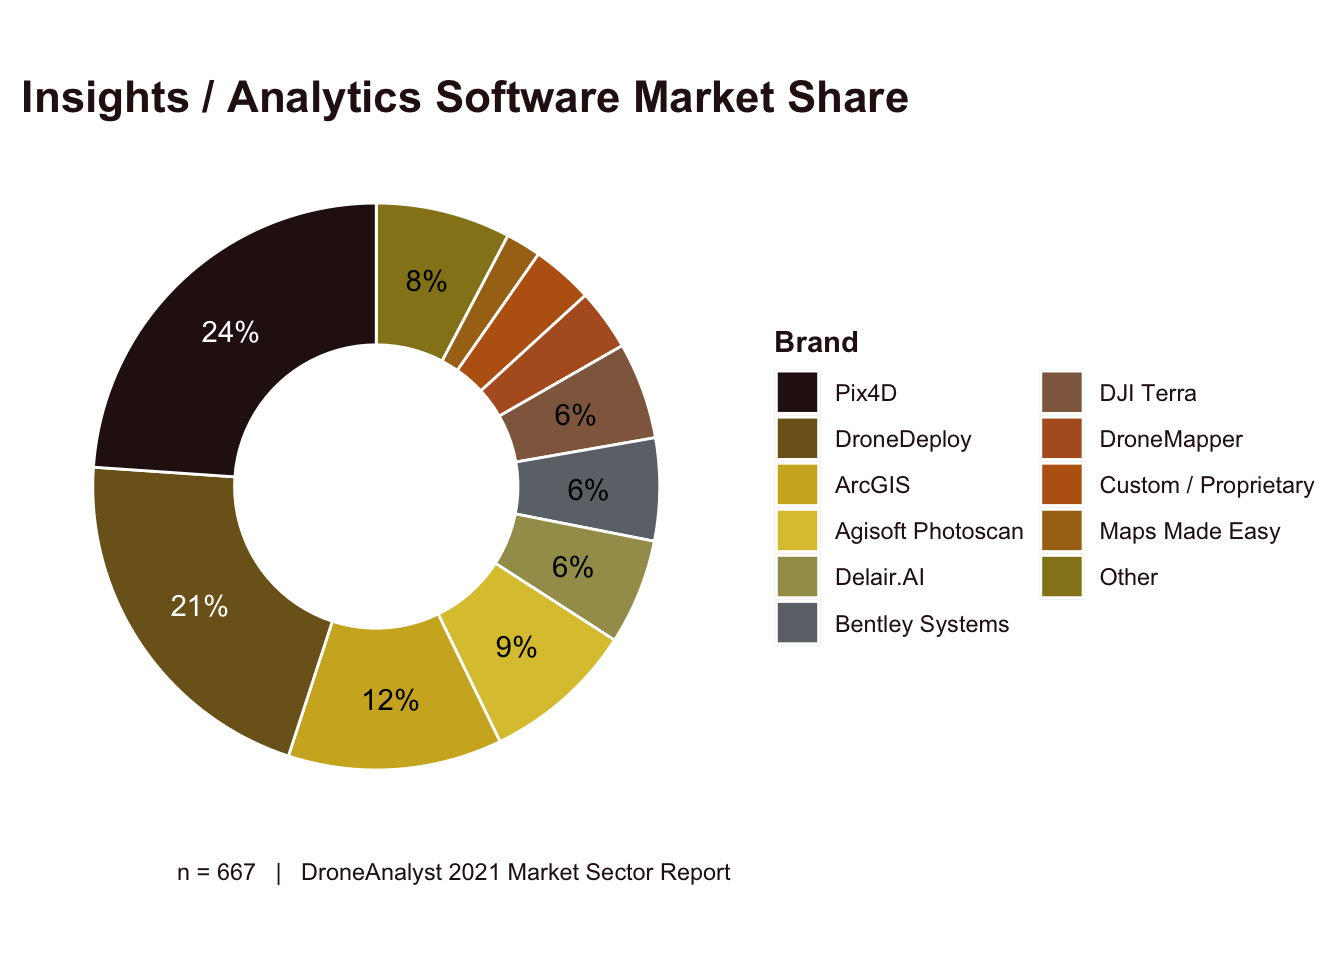
Figure 7.7: Insights / Analytics Software Market Share
Among this specific category, Pix4D led the segment in market share, albeit down 6 points from 2020. DroneDeploy remained stable at 21% market share, with a strong presence in the operations management category as well. Among our runner-up brands, we saw some movement for Esri’s ArcGIS while Delair.AI, Bentley Systems and DroneMapper all made the top 9 list while they didn’t in 2020.
This year we combined all of Esri’s various ArcGIS drone softwares (Drone2Map, Site Scan and ArcGIS Online) into one selection. Last year they had a combined 4% market share, which has essentially tripled to 12%.
Additionally, we made some changes to how we handled DJI software. Before we listed “same as the brand of my drone” and calculated this out by identifying the drone brands they purchased. As we are seeing customers purchase more diverse hardware brands, we added in options directly to account for this, which gave us a more accurate measure for DJI Terra. Previously we had estimated DJI Terra made up 2-5.8% of the market. This year they experienced some minor growth and rose to 6%. Combined with their significantly lower hardware market share, this is something to watch - but not cause - for other software brands.
We wanted to further explore this data by breaking out market share by sector. Note that this data is only for business and agency users. You can view this data in Figure 7.8.
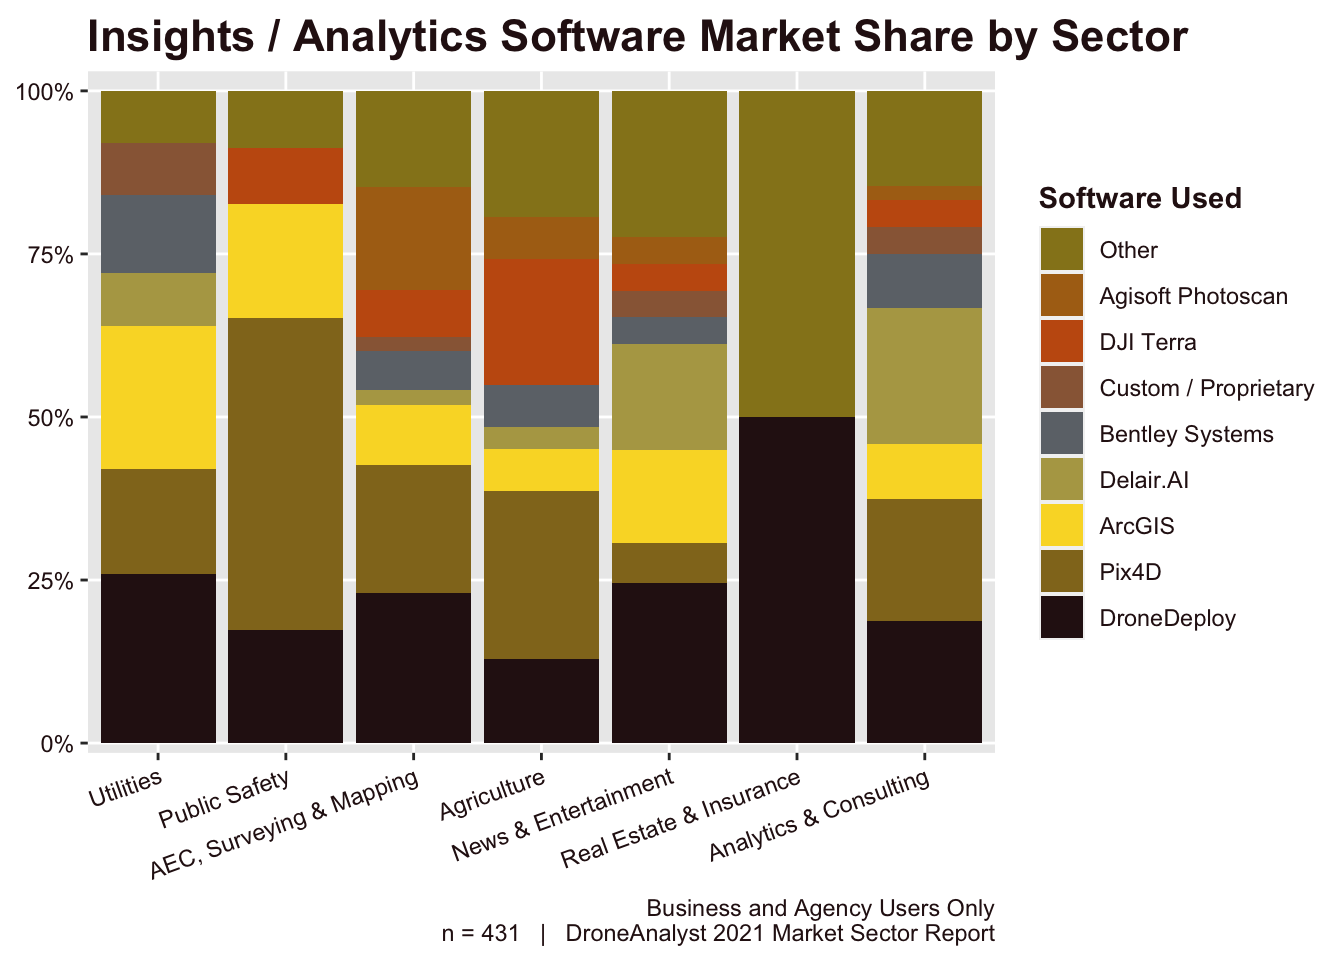
Figure 7.8: Insights / Analytics Software Market Share by Sector
One very interesting way to initially view this data is through the competition between Pix4D and DroneDeploy. While Pix4D has a larger share in this category overall, that is led by a surge in public safety users. This is most certainly due to Pix4D’s strategy of selling a cheaper, simpler public safety specific SKU whereas DroneDeploy has focused on simplifying their product among more specific pricing tiers. Additionally, Pix4D offers perpetual licenses, which is strongly preferred in the public safety sector (see Figure 7.5).
Outside of our dominant duo, we see ArcGIS with a stronger market presence in the utilities sector, beating out Pix4D among these customers. DJI Terra has no presence among utilities, where they are more likely to deploy more than just DJI drones, and has a strong focus in the agriculture sector. It’s interesting to see this trend, as DJI offers both a utilities and agriculture specific version of DJI Terra.
Next, we asked respondents about their perceived maturity of software in the insights/analysis software category. This provides a good indication for how this software addresses customer painpoints.
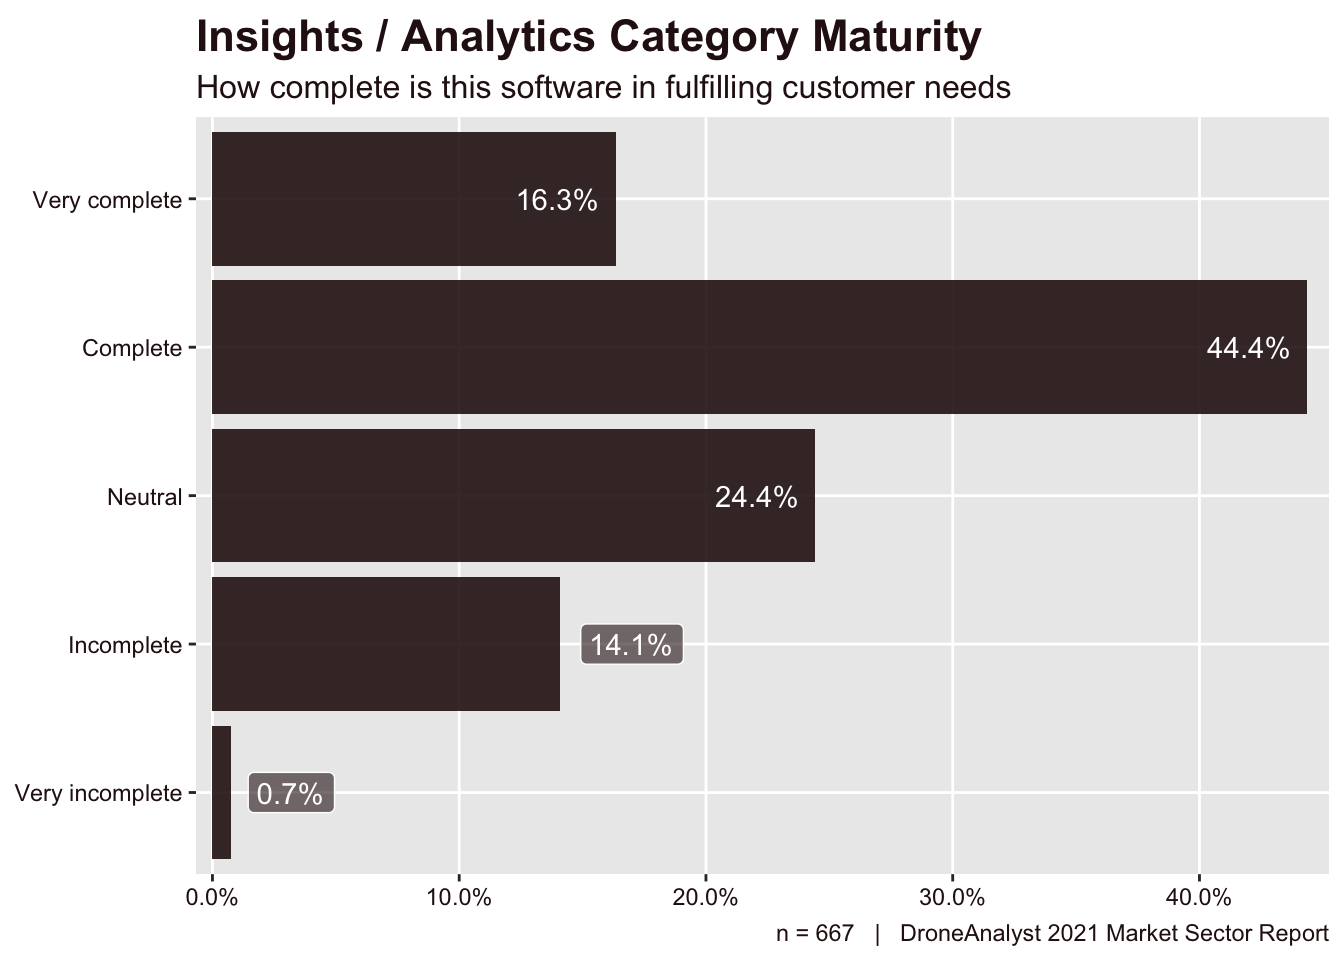
Figure 7.9: Insights / Analytics Software Category Maturity
Overwhelmingly 61% of respondents answered that their insights / analysis software of choice is complete or very complete, with only 15% answering incomplete or very complete. While this is generally a good sign, we saw a 7 point increase in customers who noted their Insights / Analytics software was incomplete.
Lastly, we asked users of Insights / Analytics software about the primary purchasing factors they consider when selecting a specific vendor.
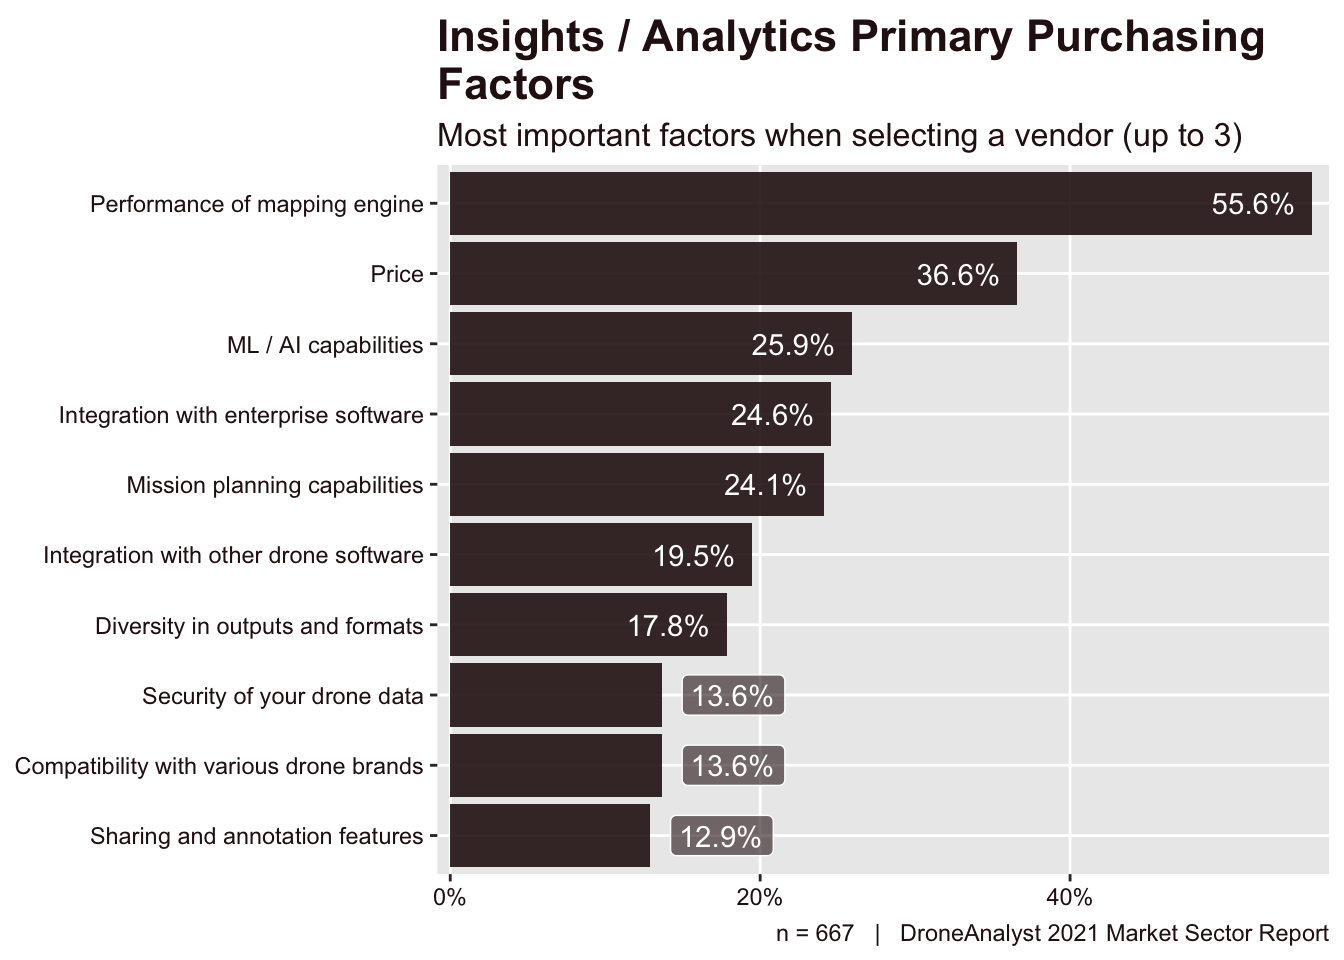
Figure 7.10: Insights / Analytics Primary Purchasing Factors
Performance of the mapping engine remains the top purchasing factor for this category, gaining 4 points over last year. This was followed by price, which experienced a 4 point drop.
The rest of the categories were selected by just a quarter of respondents or fewer, but we also saw movement in this group. Notably, ML / AI capabilities rose by 5 points, taking it from the 6th most important factor to the 3rd. Integration with enterprise software made a similar 5 point increase and move from 7th to 4th most important factor.
We have also seen brands focus more on messaging around security of your drone data, however the data appears to be moving in the opposite direction as this factor moved from 19% of buyers in 2020 to just 14% today. This contrasts significantly with the trend we see among drone operations management software, where security remains the 4th most important purchasing factor (see Figure 7.14 in the next section for more information).
7.5 Drone Operations Management Software
For users of Drone Operations Management software, we asked them several follow-up questions to better understand the software brand that they use, the maturity of the software they used and the features that drive them to select one software over another.
For our first question on which software they use, we listed 15 brands for respondents to choose from, with an additional Custom software and Other option where users could write in a brand not listed. Their responses are displayed in Figure 7.11 below.
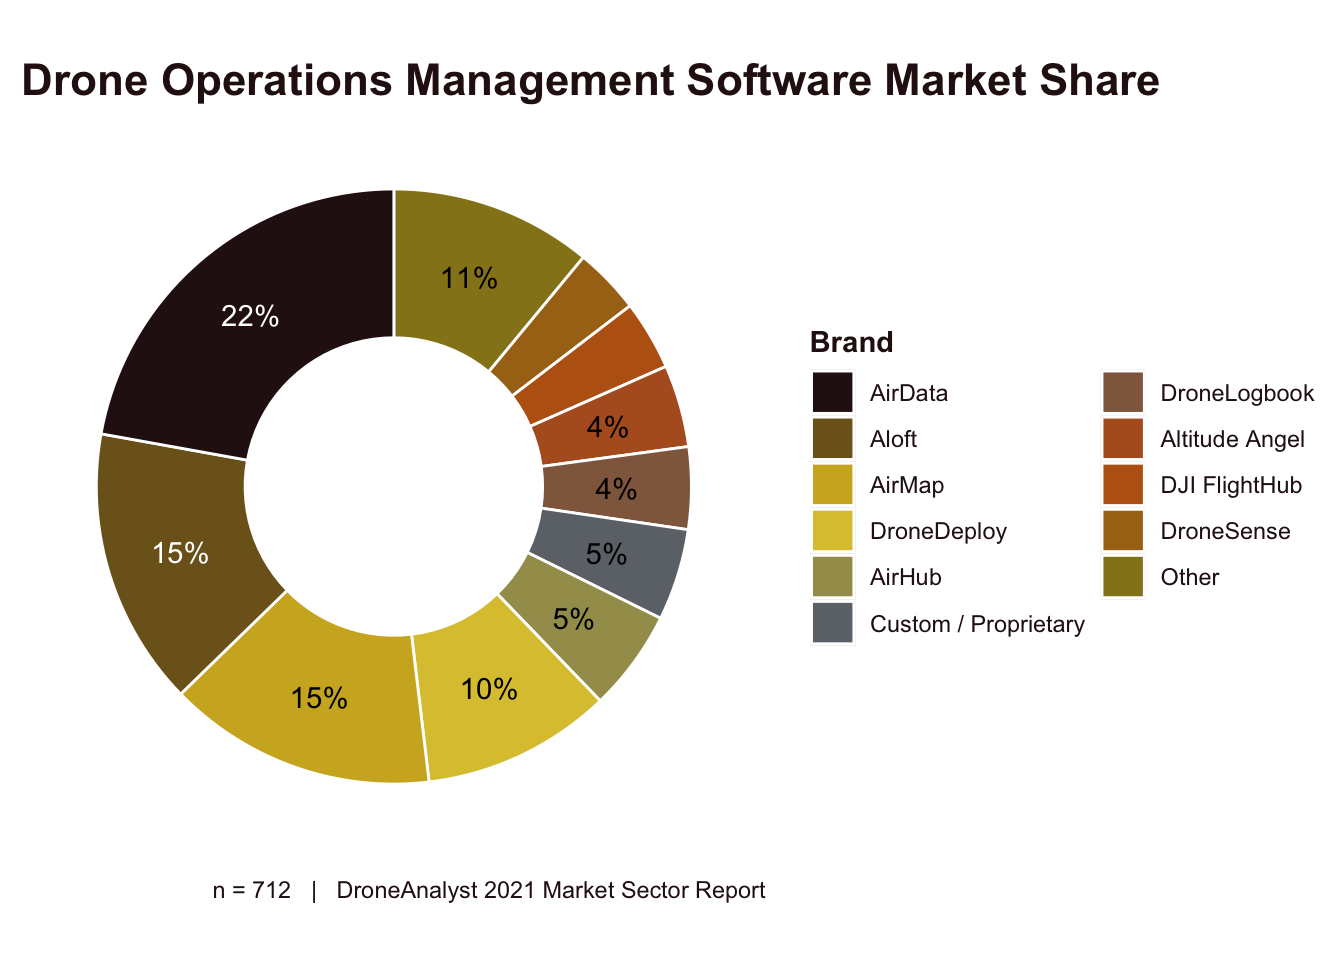
Figure 7.11: Drone Operations Management Software Market Share
AirData rose dramatically this year, from just 2% of the market in 2020 to 22% today. AirData has a freemium model, has the broadest range of supported aircraft and has worked on ways to migrate customers away from competitors or sync data directly from the drone manufacturer’s app. AirData is followed closely by Aloft, which was previously KittyHawk (we listed both on the survey for clarity). This represents a 7 point increase for Aloft over 2020, and is a mixture of enterprise and hobbyist customers as they have also developed the FAA’s B4UFly app.
AirMap has caught a significant amount of heat by lobbying for take-off and landing fees for sUAS, which we can assume would be a way to further monetize their software. This has potentially harmed their market position, where they have stagnated at 15% of the market but dropped from the leading brand to the 3rd.
DroneDeploy is the last brand to be in double digits, and speaks to the trend I’ve referenced in that they have now been classified in both the Insights / Analytics category and Drone Operations Management.
We wanted to further explore this data by breaking out market share by sector. Note that this data is only for business and agency users. You can view this data in Figure 7.12.
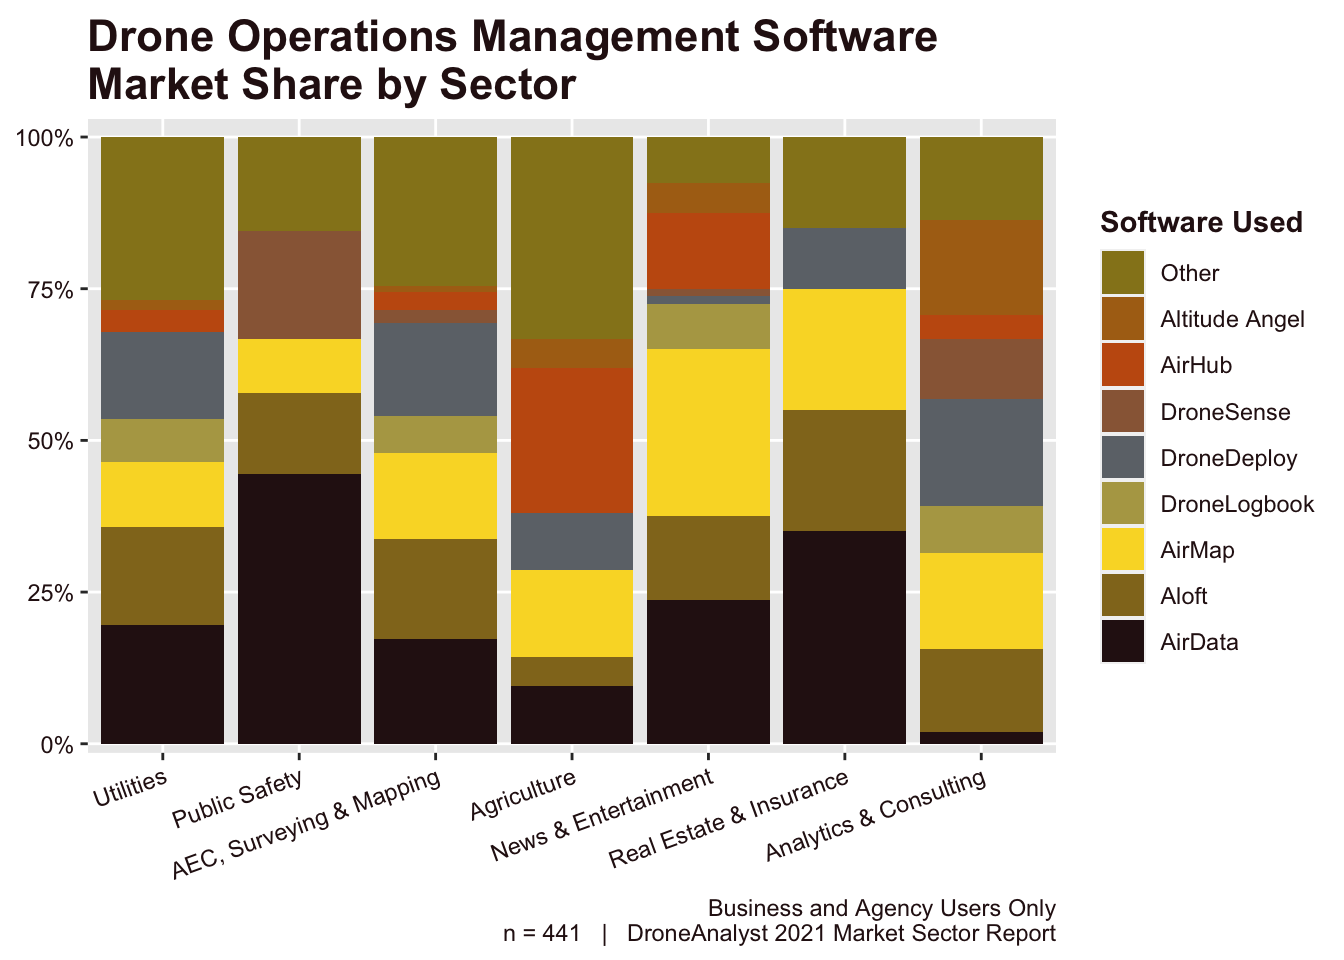
Figure 7.12: Drone Operations Management Software Market Share by Sector
We see stronger differentiation among the drone operations management category than seen in the Insights / Analytics category, as market share is more disperse in this category. Notably, we see a few players who are much stronger in a particular industry than the market overall.
AirMap tends to outperform in our less industrial sections like News & Entertainment and Real Estate & Insurance. AirHub is mostly present in the agriculture sector, DroneSense in public safety.
AirData’s market share raises to nearly half (44%) in the public safety sector, the highest for any brand in any sector.
Just as we did with Insights / Analytics brands, we asked customers of Drone Operations Management software about the completeness of the software they used. We noticed last year that drone ops software lagged behind Insights / Analytics software in maturity, so have been interested to see if that gap closes this year. We break down the findings below in Figure 7.13.
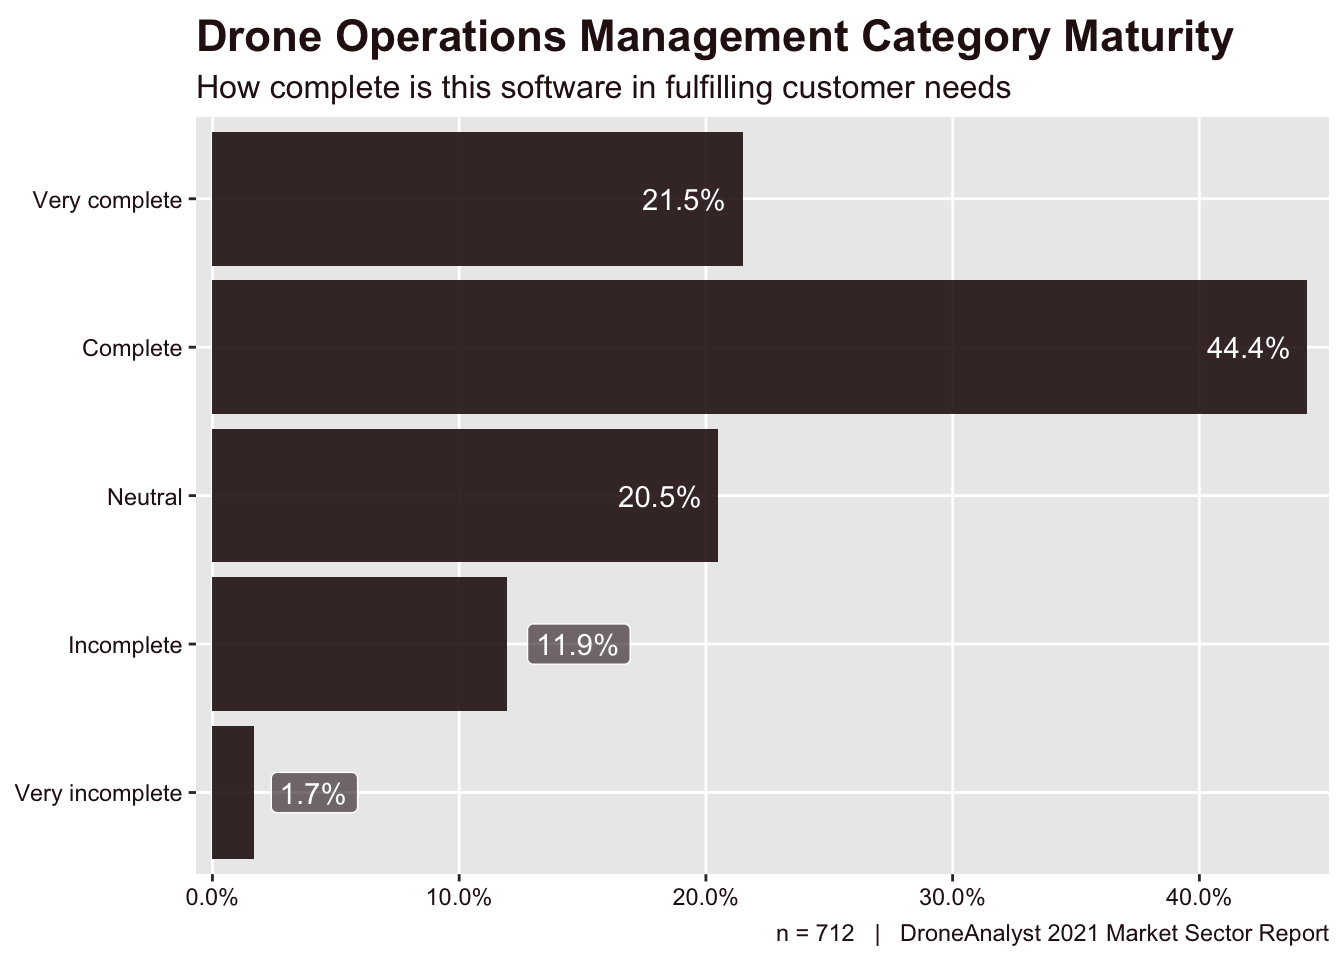
Figure 7.13: Drone Ops Mgmt Category Maturity
Two-thirds of respondents said that the drone operations management software they used was either complete or very complete, with only 14% answering incomplete or very incomplete. While those answering positively only increased by 2 points, we saw a 6 point dropoff in those selecting incomplete.
When compared to our findings on Insights / Analytics software category maturity (Figure 7.9), we can see that our trend last year reversed as drone operations management software are perceived as more mature than Insights / Analytics software.
Putting together the trends we are seeing towards more mature deployments and drone ops software being more core to operations (Figure 7.2) with this shift in perception, it makes sense that drone ops software has become critical to drone programs looking to scale.
Lastly, we explored the purchasing factors driving customers to select a particular drone operations vendor in Figure 7.14.
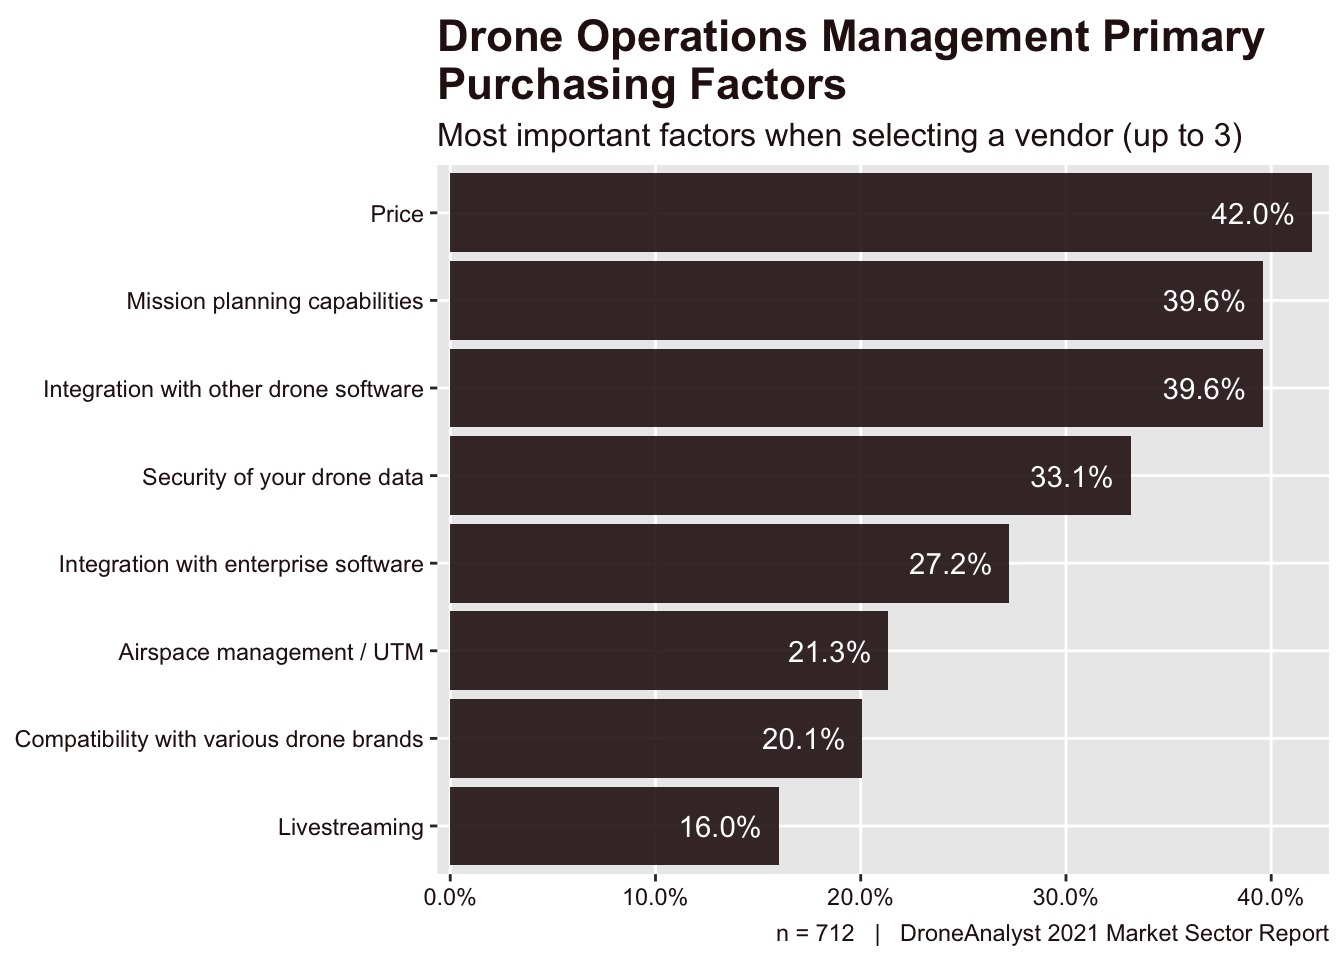
Figure 7.14: Insights / Analytics Primary Purchasing Factors
We see a large divergence between the top four factors selected by more than a third and up to nearly half of respondents and the lesser four factors. Purchasers’ primarily prioritize price, followed by mission planning capabilities and integration with other drone software tied for the 2nd most critical purchasing factor. This represents a small drop in importance for price and planning capabilities (5 and 3 points), while integration with other drone software rose 3 points.
Seeing as how security ranks fairly low for both drone buyers (Figure 4.24) and Insights / Analytics software buyers (Figure 7.10), we are surprised to see security of drone data continuously rank 4th in this section.
Among the bottom four preferences the most movement has been increased preference for integration with enterprise software, which jumped 7 points this year, the highest among any individual purchasing factor. This similarly reflects the increased maturity of deployments, and a larger proportion of business and agency users in our survey.