Section4 Drone Aircraft and Payload Purchases
Introduction
A total of 1,408 respondents answered to the qualifying question and the following questions for this section. The confidence level for this portion of the survey is 95% ± 2.61.
As our qualifying question for this section, we asked: “Have you or your organization purchased a drone in the past 12 months?” [Q5]. Respondents were able to answer no or conversely they had two affirmative options – separating out those who have made a single purchase from those who have made multiple purchases. We designed two separate paths for these respondents so we could tell a more nuanced view of the market, although the paths are nearly identical and have been aggregated for calculating key metrics.
Of those who purchased a drone in the past 12 months, 52% made a single drone purchase while 48% made purchases of several aircraft. This reflected a slightly larger portion of our respondents who purchased several aircraft (up 8 points from 40% in 2020). Among those who purchased several drones, on average they purchased 7.6 drones from 2 different manufacturers.
List of Figures
Purchase Objectives and Buyer Segmentation
4.1: Primary Sector of Purchase
4.2: Primary Use of Purchase
4.3: Changes in Professional Purchase Objectives
Drone Aircraft Types
Top Drone Brands
4.6: Drone Brand Market Share
4.7: Drone Brand Market Share by COO
4.8: Historical Country Market Share
4.9: Drone Brand Market Share by Sector
4.10: Drone Brand Market Share by Region
Price Points
4.11: Most Expensive Drone Purchased
4.12: Most Expensive Drone Purchase by Sector
4.13: Use by Price
Purchase Channels
4.14: Where Drones Are Purchased
4.15: Changes in Place of Purchase
4.16: Purchase Channel by Sector
Payloads
4.17: Camera and Sensor Integration Method
4.18: Sensor Type(s)
4.19: Sensor Type(s) by Sector
4.20: Sensor Brand Market Share
4.21: Add-on Payload Market Makeup
Additional Mounted Accessories
Purchasing Decision Factors & Security Requirements
Impact of Security Concerns and New Regulations on Chinese-Made Products
List of Tables
- 4.1: Changes in Drone Prices Over Time
4.1 Purchase Objectives and Buyer Segmentation
We begin our analysis by first analyzing responses to our question asking about the primary use of their drone purchase. This provides better context to the rest of the data in this section, and allows us to better break down our later analyses into specific sectors.
Our question on primary use of their drone purchase was a single choice question, where the respondent could either type to find an option, or select from a menu of options. In total there were 23 options, which we have further filtered into 10 sectors and and 3 broad categories (Hobby, Commercial Imaging and Academic & Other). It is important to note that these sectors and broad categories are used to simplify the interpretation of the data, and were not shown to the respondents. This allows us to better break down our findings into neat categories without running into the challenge of displaying 23 unique categories. A similar logic is used in all sections of our report.
For this section on drone aircraft and payload purchases, we have further broken down many of our later questions by respondents participation in a specific sector within the Commercial Imaging category. This may sound initially complicated, but will be intuitive when viewed. The first figure with such a breakdown is Figure 4.5 breaking out the various drone types used across the defined Commercial Imaging sectors (Utilities, Public Safety, AEC, Surveying & Mapping, Agriculture, Photo & Entertainment and Real Estate & Insurance).
Figure 4.1 below shows the breakdown of respondents by these 10 fabricated sectors, arranged by the broader category (labeled on the right of the graph). The detailed use cases fitting into each sector can be found in Figure 4.2.
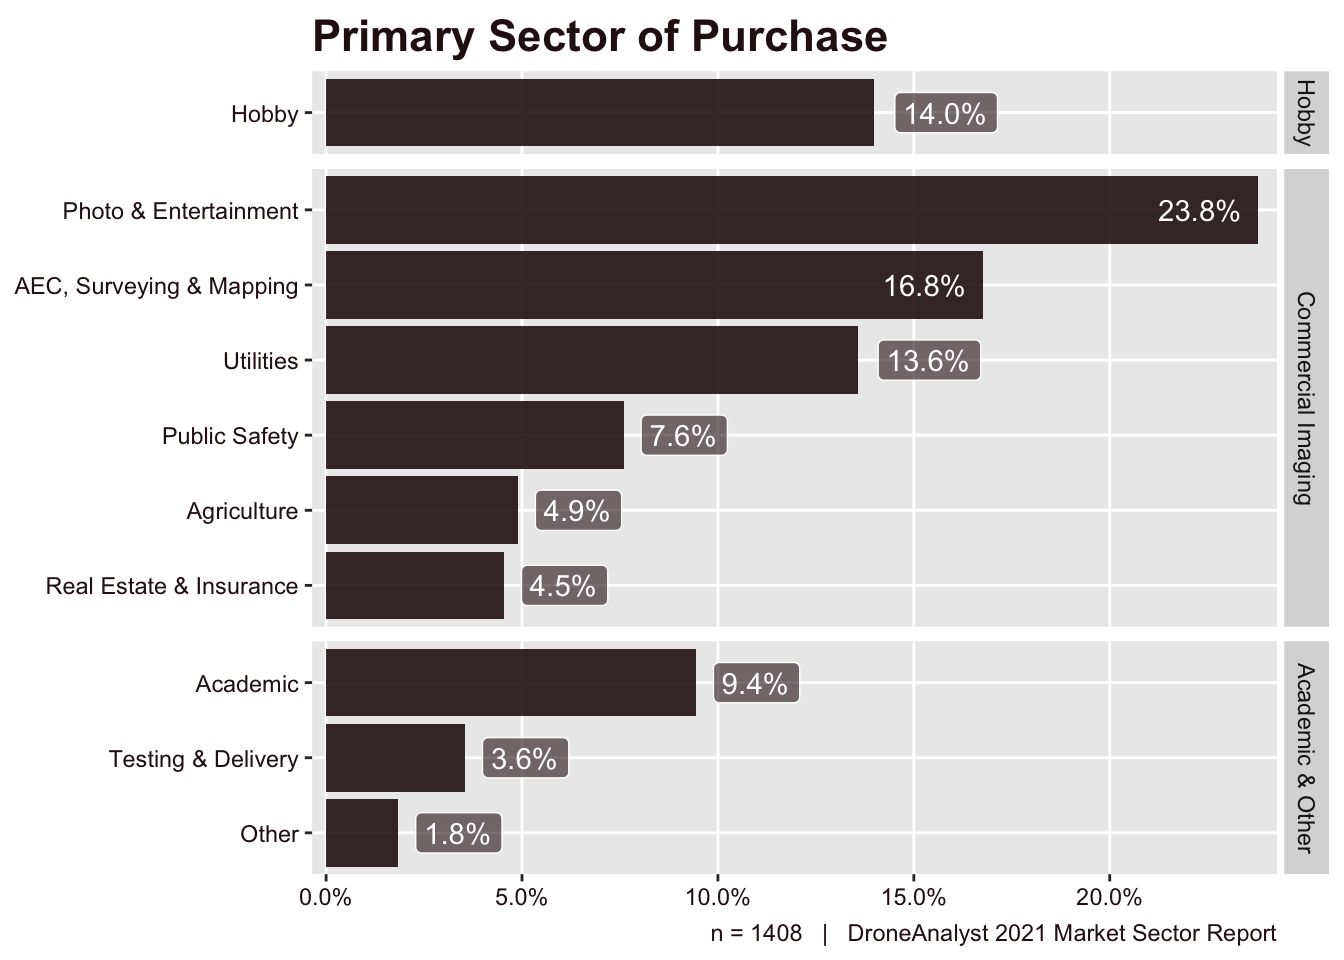
Figure 4.1: Primary Sector of Purchase
71% of all respondents who purchased a drone in the past 12 months, did so for a commercial imaging use. Notably, we saw a relative decrease in hobbyist purchases, down 8 points to just 14% of all purchases.
Among Commercial Imaging uses, Photo & Entertainment uses continue to be the dominant reason for purchasing a drone.
We further explore historical trends in professional purchase objectives in Figure 4.3.
Figure 4.2 below further explores the breakdown of various purchase objectives and how they fit into the listed sectors in Figure 4.1 above. This chart is quite detailed and is mostly used to provide further context for those interested into our categorization of sectors.
Due to the sheer amount of information contained on this figure, we have used shorthand for both the sectors and purchase objectives. The survey used categories with very descriptive and repetitive names to accommodate for respondents searching for a keyword.
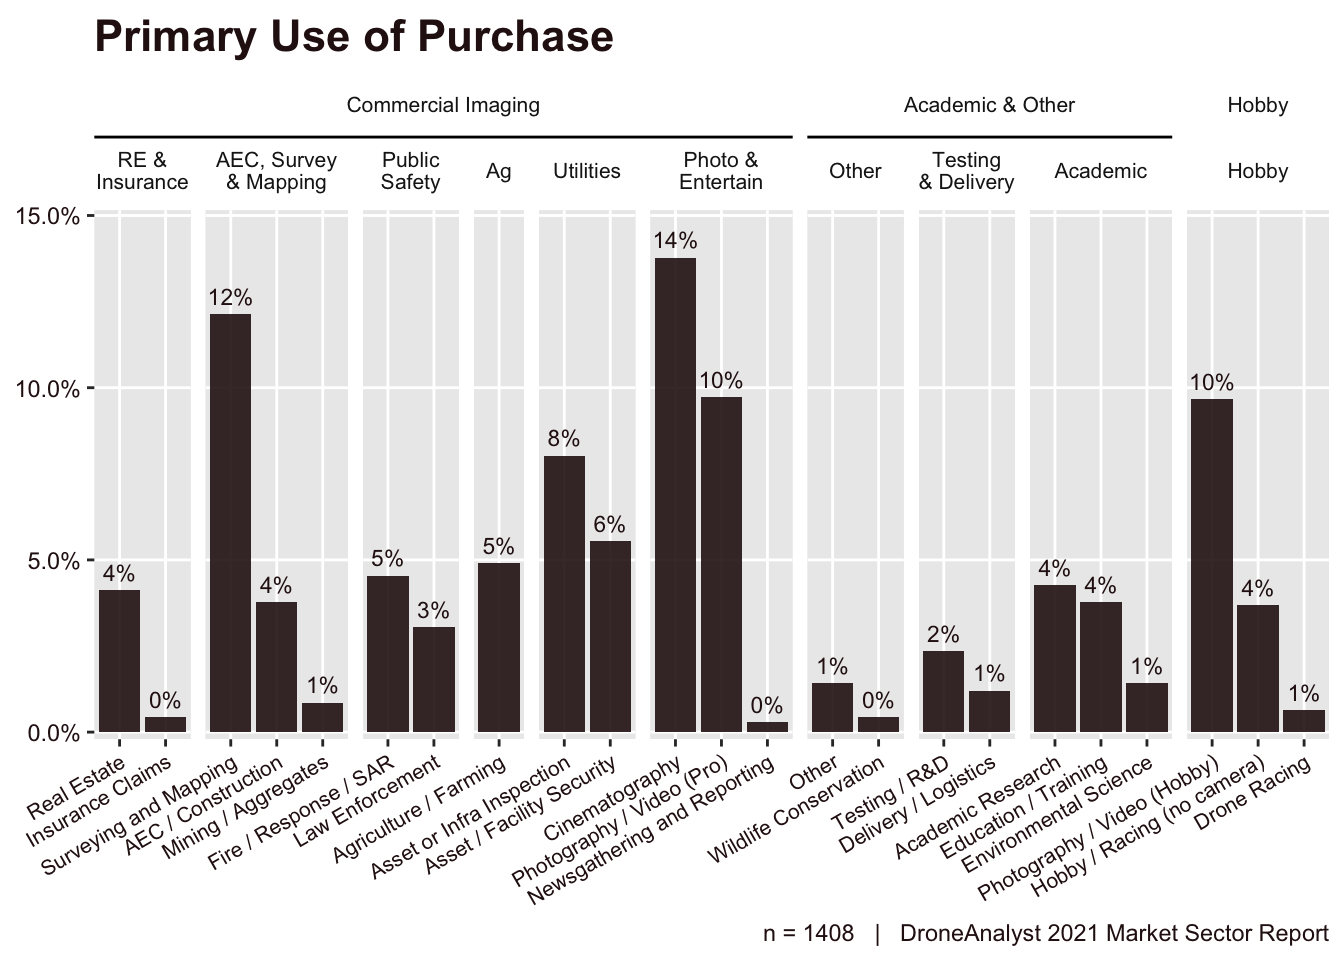
Figure 4.2: Primary Use of Purchase
This chart can’t tell us much more than our initial figure in this section, but it can be interesting to see what keywords users in a sector chose. For example, in the AEC, Surveying and Mapping sector, users overwhelmingly chose Surveying and Mapping instead of AEC / Construction, which speaks to how these users categorize their work.
Last in this section, we have analyzed the change in professional purchase objectives of our respondents over time in Figure 4.3 below. Please note that since our categories have changed over the years, the sectors used above to not match perfectly with those used in this figure. However, it does provide some important context into the type of representation we had in this year’s report.
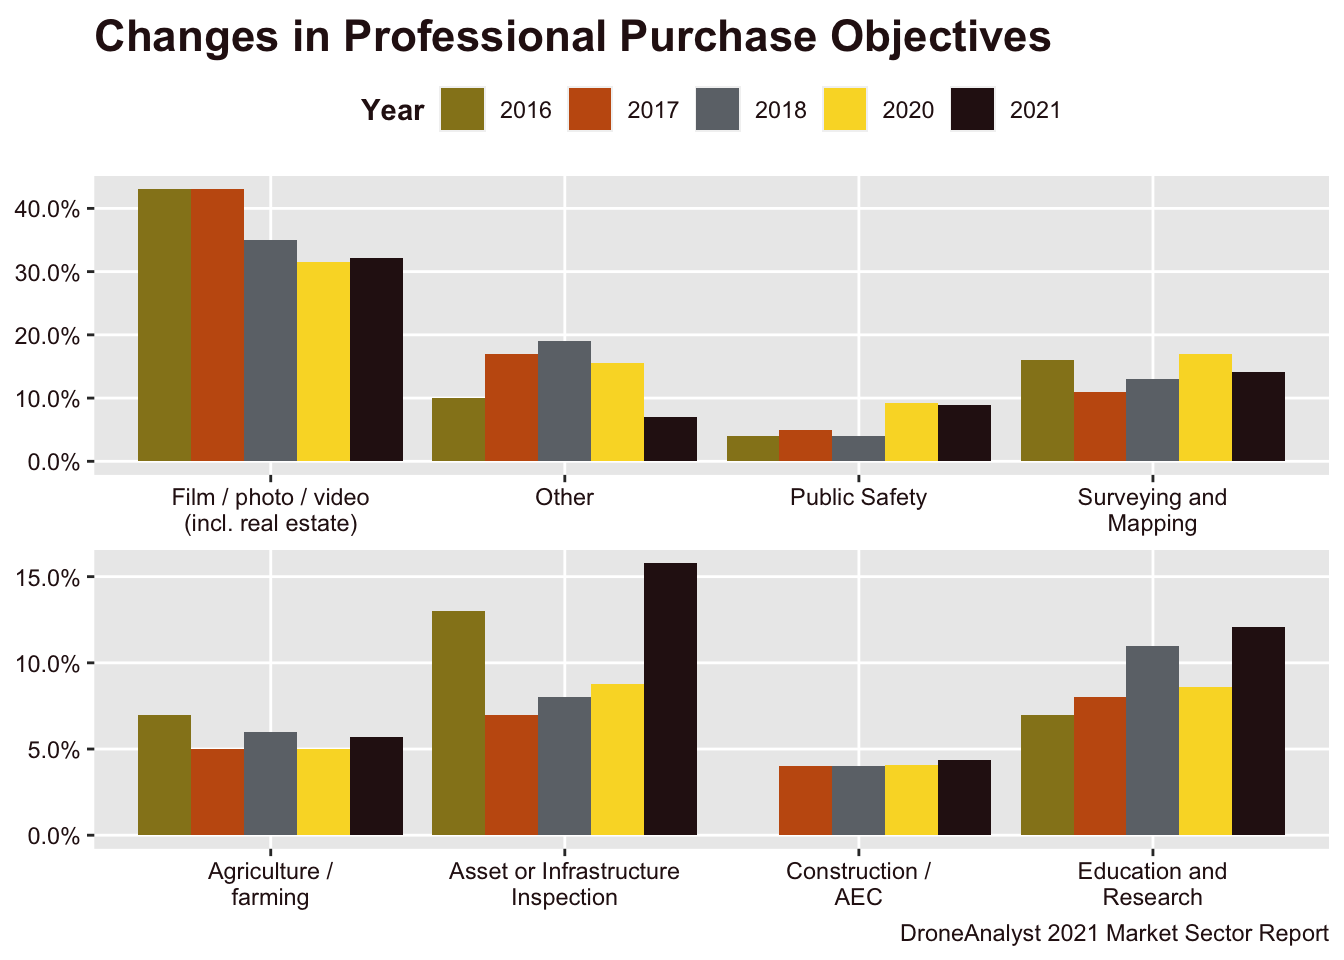
Figure 4.3: Changes in Professional Purchase Objectives
Overall, purchase objectives did not shift dramatically compared to 2020. The only notably exception being Asset or Infrastructure Inspection, which nearly doubled from 8.8% in 2020 to 16.3% today. This reflects the increase in business and agency user respondents and the increased maturity of energy sector applications for drones.
4.2 Drone Aircraft Types
Our first question in this section asked about the type of drone aircraft purchased. Options were separated out between (1) fixed wing, (2) single-rotor, (3) quadcopter or tricopter, (4) hexacopter, octocopter or larger and (5) hybrid VTOL. Respondents who purchased several drones were able to choose more than one drone type, while those who purchased a single drone could select only one. Answers appear below in Figure 4.4 below.
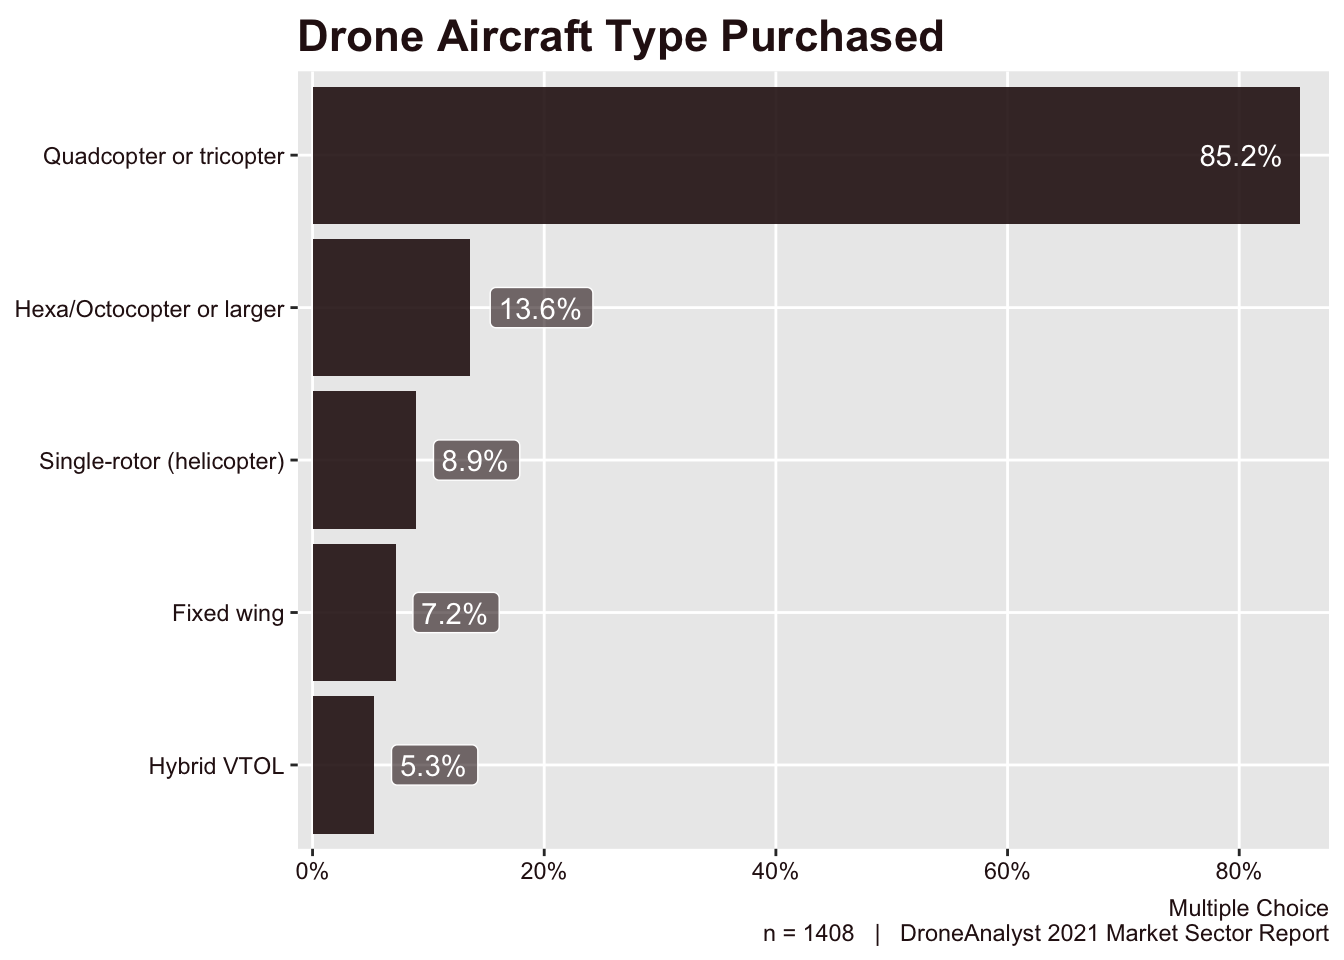
Figure 4.4: Drone Aircraft Type Purchased
Results show that in the last 12 months more people bought multirotors (85%) than any other type. While multirotors are still king, they did see a 8-point drop as all other categories except Fixed Wing increased significantly over last year.
Fixed Wings decreased by half a point from 2020, dropping from the second most used type to third. This reflects the move towards more sophisticated Hybrid VTOLs for BVLOS missions (which doubled from 2.6% in 2020). Hybrid VTOLs are generally more expensive than Fixed Wing aircraft, but have the ability to fly for an extended duration like a fixed wing while landing and taking off more accurately like a multirotor.
This shift makes sense as organizations prepare to conduct advanced operations like BVLOS which require additional sensors mounted onboard. A Fixed Wing essentially “crashes” to land each time, and a Hybrid VTOL can generally lift additional payloads onboard. Considering that much of the cost for advanced operations goes towards additional sensors, waiver processes and eventual certification, choosing a higher priced Hybrid VTOL configuration is worth it.
SenseFly, a Parrot company, has been an early entrant to the fixed wing market. We have analyzed Parrot’s financials publicly and have seen a slow decrease in revenue for their SenseFly fixed wing business unit. This is not to say that the Fixed Wing market is decreasing overall, as newer entrant Wingtra has overtaken SenseFly (see Figure 4.7), but that this segment is growing slower than the overall drone market.
Within the larger multirotor category, we do see large differences between quadcopters and larger Hexa or Octocopters. Generally drones with additional rotors boast improved carrying capacity/flexibility in payloads and redundancy. While these larger airframes make up the second largest group chosen (at 13.6% of purchases), they don’t compare to the smaller quadcopter category. That being said, they saw a large, 5-point uptick over 2020 where they made up just 8.4% of purchases.
Across all drone types, possibly the most interesting trend is the rise of single-rotor (helicopter) aircraft. Last year, this category was the least represented category, at just 2.2% of drone purchases. Now they are third overall. Single-rotors often fit into the same category as hexa or octocopters when it comes to the reason they are purchased. These airframes tend to be more modular and have higher payload capacity than tricopters or quadcopters. This is done not through having a larger aircraft, but by simply being more efficient. Notable single-rotor designs include the Spirit from Ascent AeroSystems and Vapor from AeroVironment.
All of these drone types have nuanced trade-offs and will therefore perform better for certain applications and customers. This year, we took a look at how much drone buyers across various sectors preferred each drone type. These findings can be seen in Figure 4.5 below.
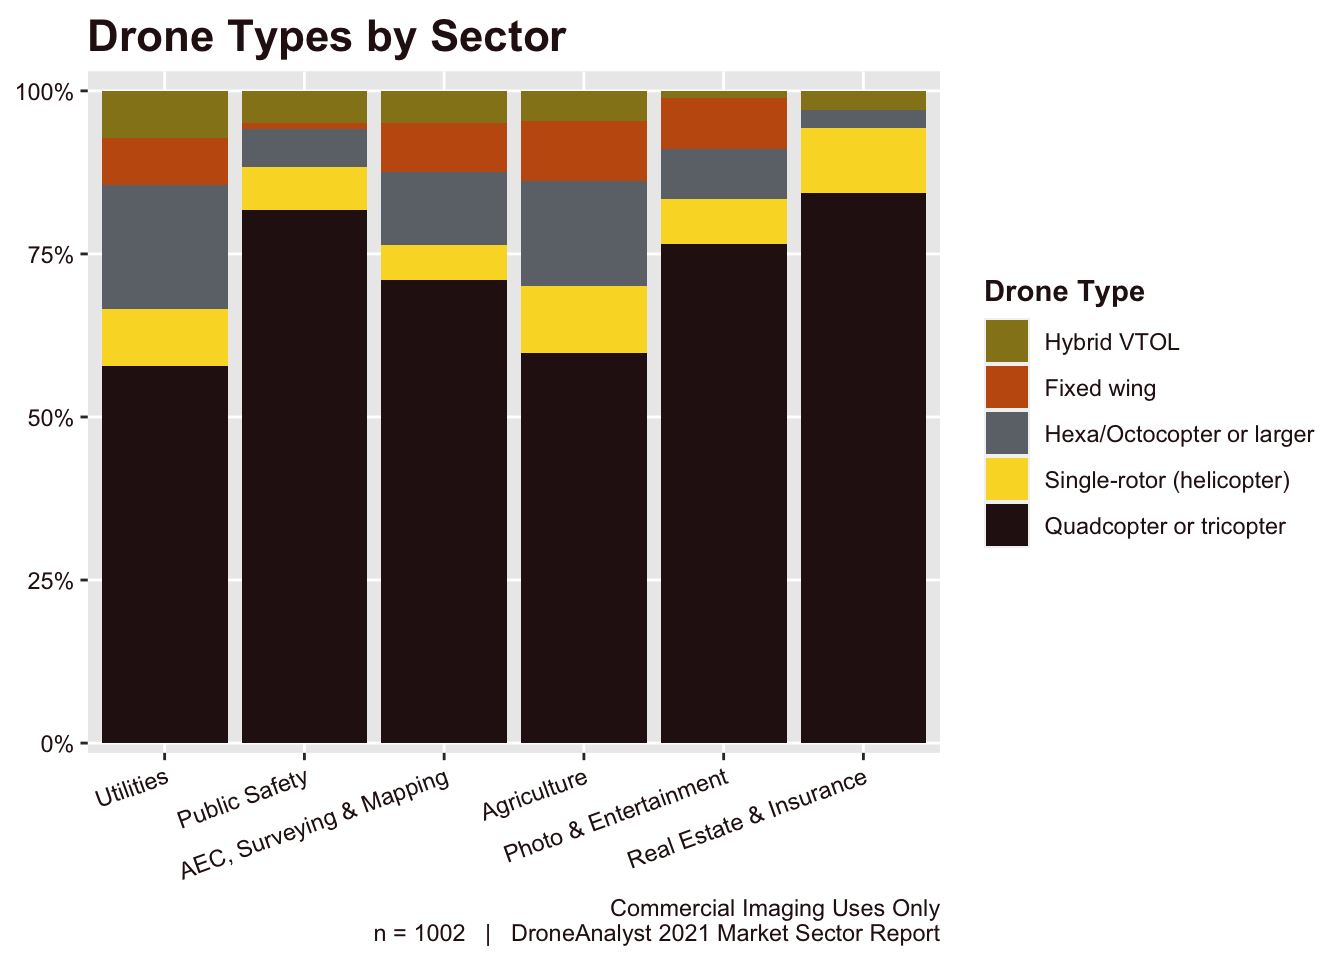
Figure 4.5: Drone Types by Sector
Customers in the utilities and agriculture sectors purchased the most diverse drone fleets, with tri / quadcopters making up less than 60% of their purchases. These same groups of buyers were also the most likely to buy a Hexa/Octocopter or larger. This makes sense when considering that many of these customers have the need to mount additional sensors, such as a LiDAR scanner or multispectral/hyperspectral camera.
Public Safety and Real Estate & Insurance customers were most likely to purchase a quadcopter or tricopter. While we expect this trend to remain for real estate and insurance applications which are fairly simple, as other drone types become sufficiently mature, we expect Public Safety to start adopting more diverse drone types.
4.3 Top Drone Brands
We asked respondents who had obtained a drone in the last 12 months what brand they chose. We listed 23 brands, but survey takers could also choose the option “Other” and were asked to write it in. Respondents who purchased multiple drones were able to select or write several brands. Individual responses were parsed out dynamically and we received 25 brands with more than 2 responses. It’s important to note that this method does not let us understand how quantities of drones purchased varied by individual buyers, but we have found it to be an accurate proxy for market share in the past.
As many of these brands represented a small fraction of the market, we have lumped many of these smaller brands into a large Other category. The results can be seen below in Figure 4.6.
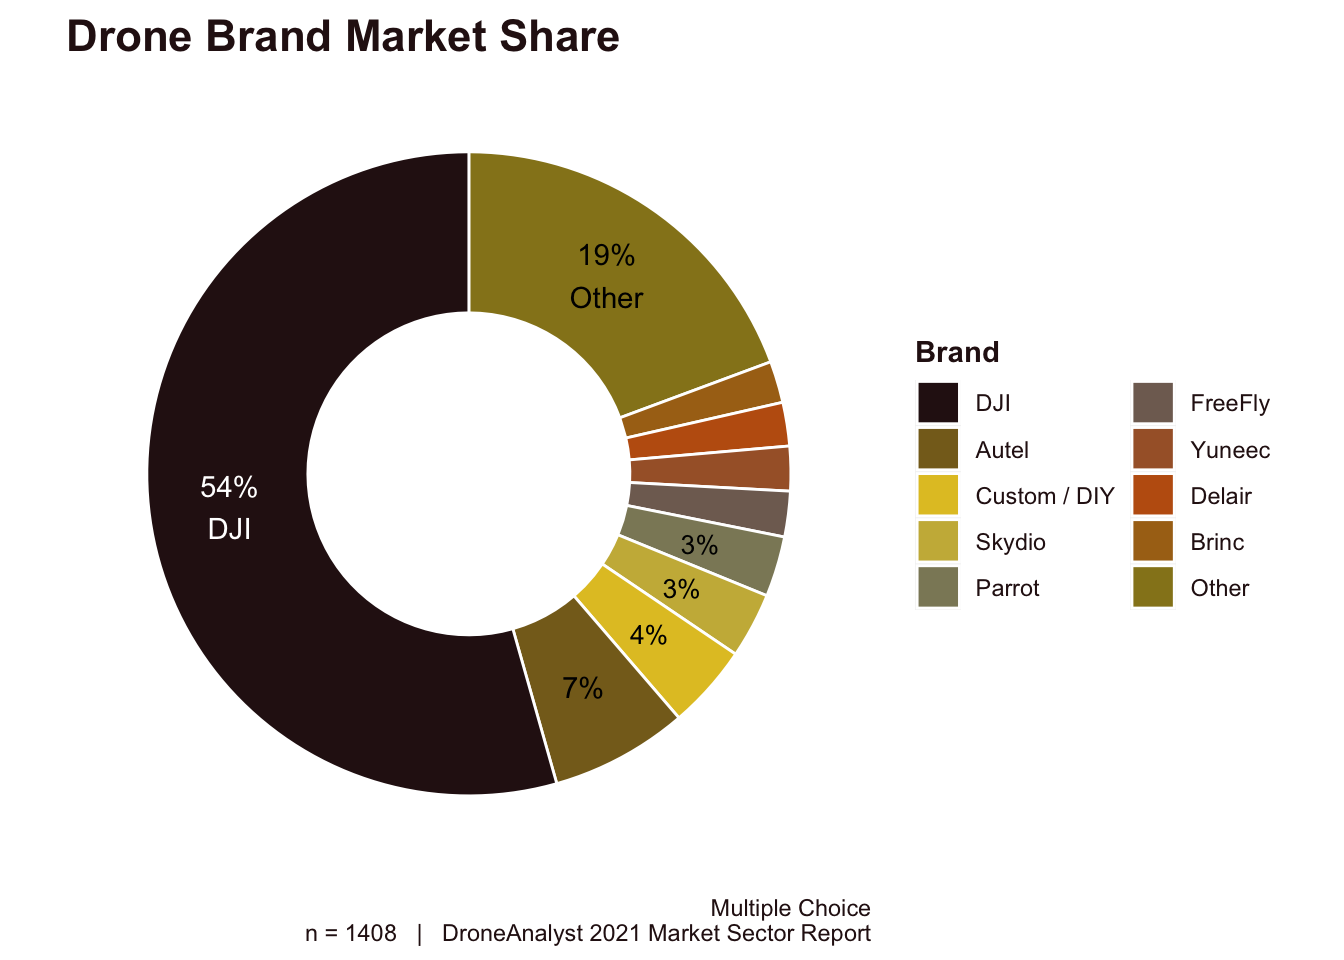
Figure 4.6: Drone Brand Market Share
This data clearly shows that DJI continues to dominate the brand list, with a 54% global market share (we explore the regional breakdown in Figure 4.10). While DJI’s leadership remains secure, this is a big departure from their historical position in the market. Last year, we found that (DJI’s market share dropped for the first time ever)[https://droneanalyst.com/2020/12/04/four-forces-that-shaped-the-drone-industry-in-2020] and noted this was likely an inflection point, but that was a minor, 5-point drop from 74% to 69%. This year represents a significant, 15-point drop to a 54% market share.
The largest gainer to DJI’s diminished market share is Autel Robotics, a Shenzhen, China based firm who benefits from doing business in the same ecosystem of talent and manufacturing resources as DJI. Skydio remained at 3%, but that is likely due to supply constraints instead of customers choosing other brands. We have seen evidence that they are getting past supply hurdles, so will be paying close attention to their performance in 2022.
As we have discussed publicly, (Parrot has struggled in its pivot to enterprise)[https://droneanalyst.com/2021/04/28/how-large-is-the-drone-market], which is represented in their financial filings and their drop from second place in 2020 at 5% market share to just 3% in 2021. Their latest Anafi Ai is an interesting pivot towards BVLOS and autonomous operations, but it isn’t clear when this product will be commercially available and whether or not it meets the needs of customer deployments today.
These market share metrics should not be taken in isolation, as the drone market is splintered across region and industry sector. We further explore market share across industry sector in Figure 4.9 and by region in Figure 4.10.
DJI’s grip on the commercial drone ecosystem is similarly loosening. With their move to (undermine their enterprise channel partners)[https://droneanalyst.com/2021/03/16/drone-channel-mayhem-dji-rewrites-the-rules/], we have seen many of their sales partners like Axon, RMUS, FlyMotion explore partnerships with other brands. Software vendors like DroneDeploy, Measure, SkyeBrowse, Skyward, Stockpile Reports and more have all announced compatibility with other quadcopter manufacturers in the past year as well. This will have ramifications across the entire drone ecosystem, and not all positive, as a fragmented hardware market could also add additional complexity for customers.
To better look at how hardware market share is playing out in the larger geopolitical environment, we have created a treemap of this market share data, grouping by a manufacturer’s headquarters location (which does not always equal country of assembly/manufacture) and proportional to each firm’s share of drone sales. That can be viewed in Figure 4.7 below.
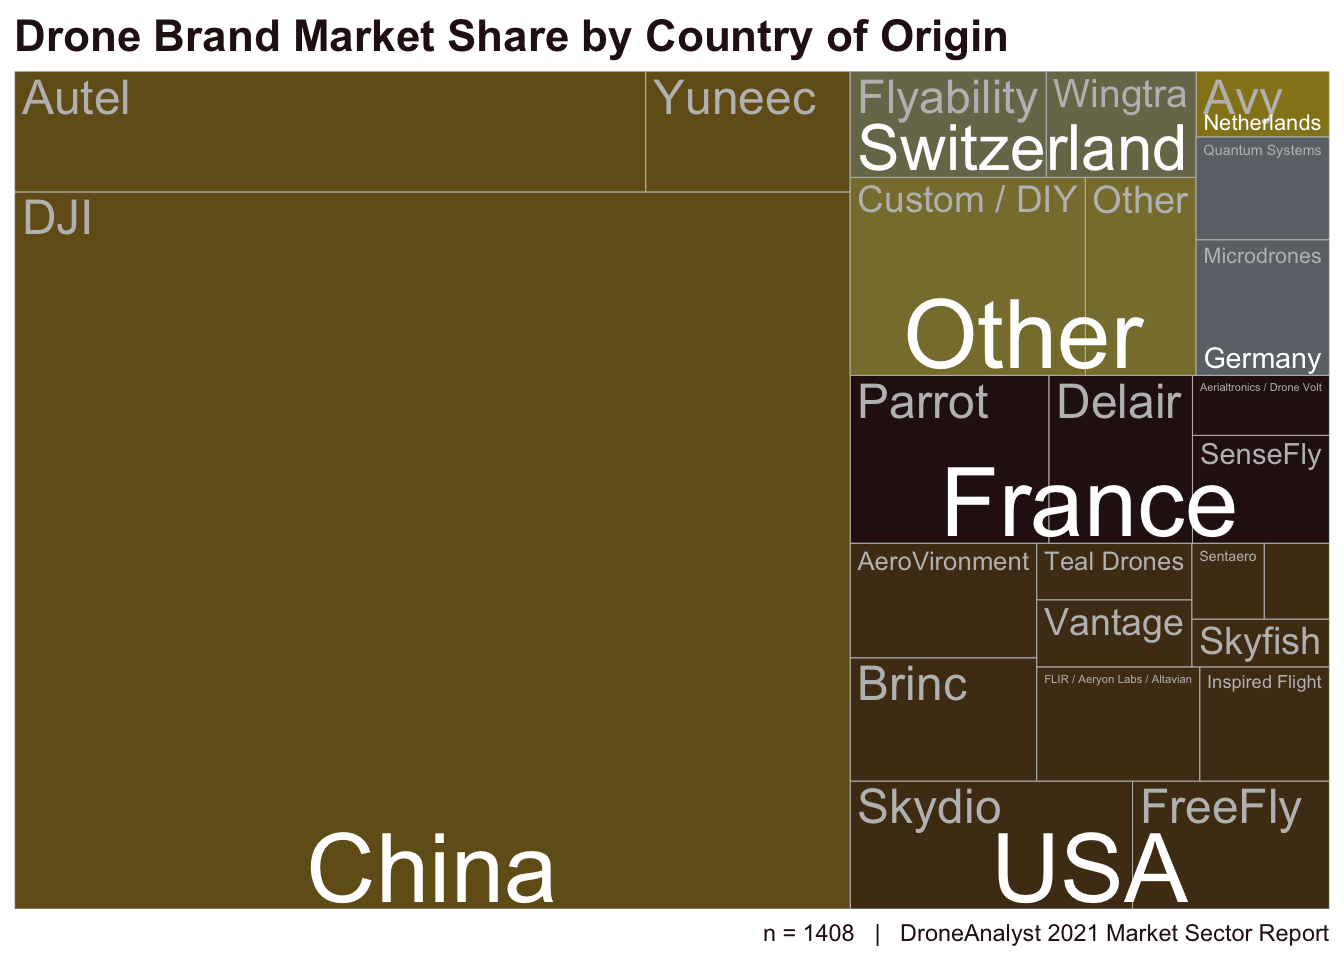
Figure 4.7: Drone Brand Market Share by COO
China’s dominance in the drone hardware sector is immediately apparent, with a combined 64% market share. America, with the most diverse drone ecosystem, has surpassed France in second at 16%.
American manufacturers now make up a larger portion of the global drone market than ever before. We showed how this plays out historically in Figure 4.8 below.
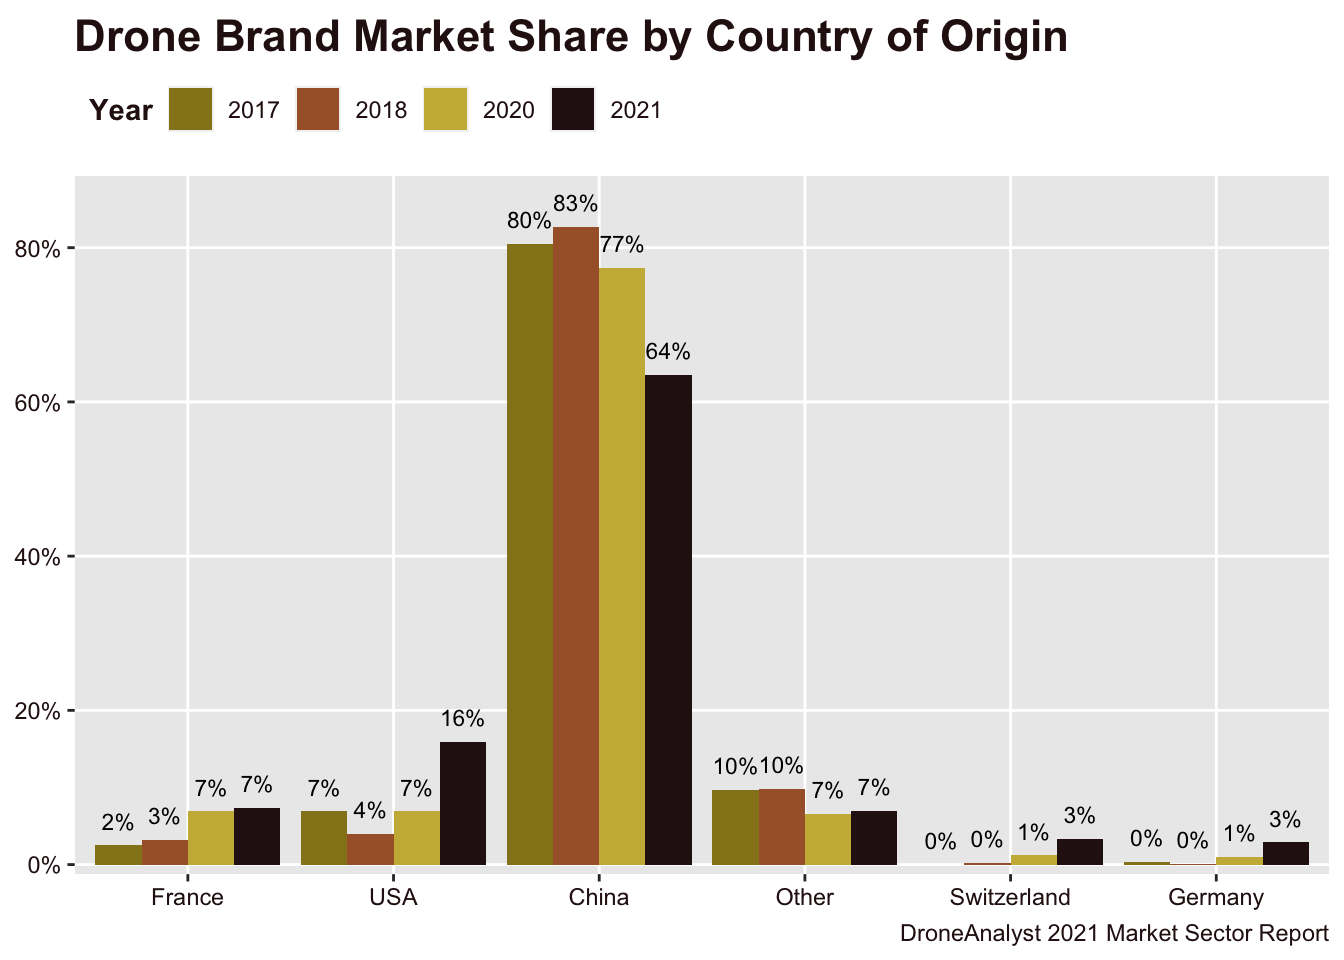
Figure 4.8: Historical Country Mkt Share
This is a better visual representation of the major shift we saw in our 2021 data. Certainly this is partially due to policies and focus that the US government has put on domestic American manufacturers, but also reflects unique and varied approaches to drone solutions. From automation-heavy approaches like Skydio to highly tailored functionality like Brinc Drones, we have more hardware diversity than ever before.
As mentioned before, we have also explored how drone market share differs across sectors, which is shown below in Figure 4.9.
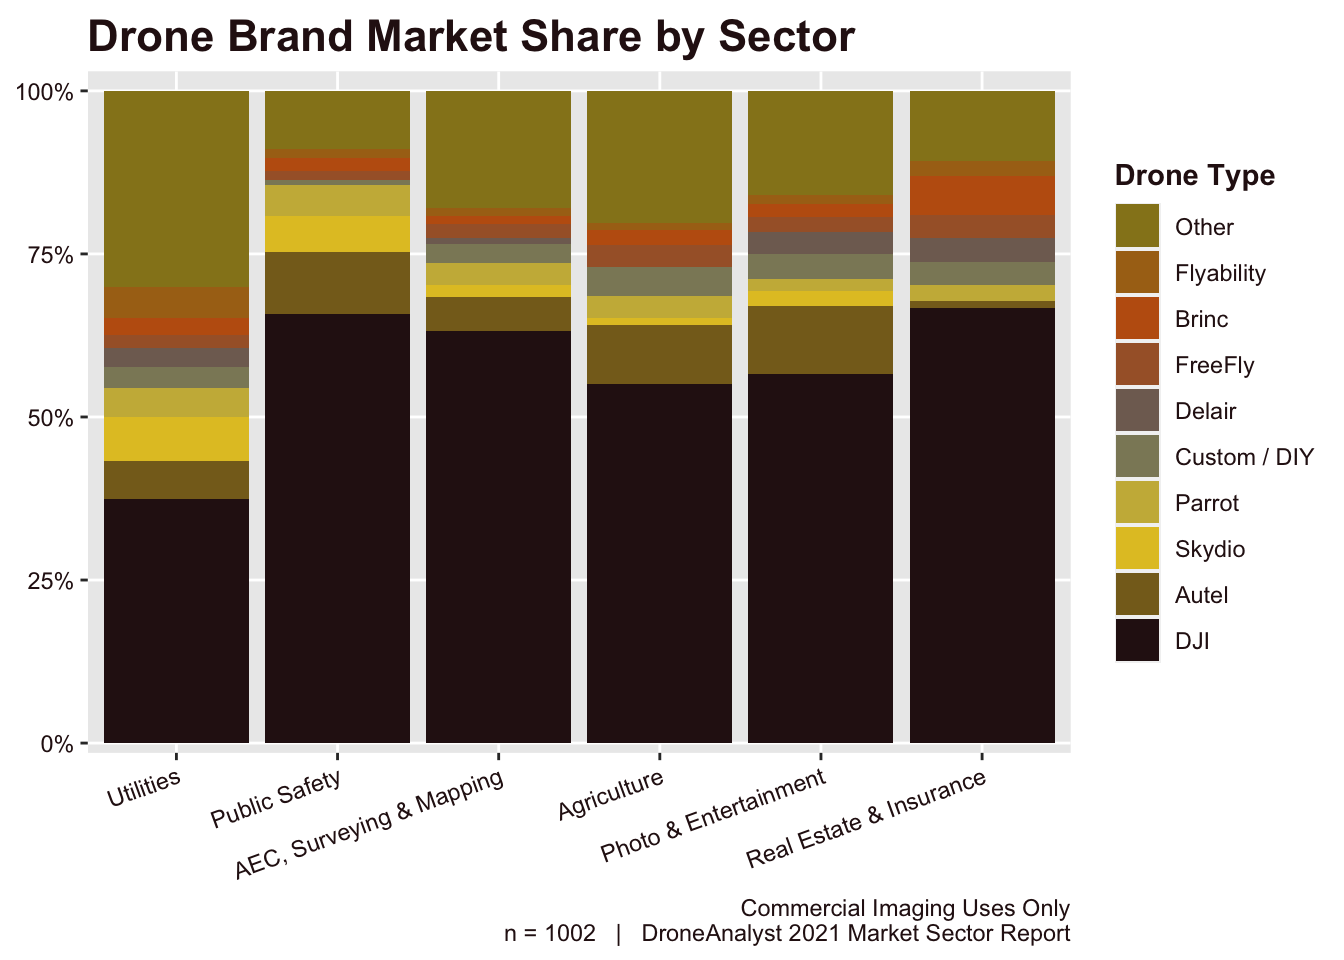
Figure 4.9: Drone Brand Market Share by Sector
DJI’s market share is strongest among Public Safety agencies, and drops below 50% among utilities. This significant dropoff among utilities reflects their use of more diverse drone types that we explored in Figure 4.5. This is similar to trends seen by Autel, whose products mostly overlap with DJI’s line of products.
Skydio is heavily focused on the Utilities and Public Safety sectors, where autonomy has immediate value to their use cases and they have invested significant focus towards.
This figure also provides some insight into the leading manufacturer of caged drones for indoor inspections, Flyability, who is the fourth largest manufacturer for drones in the utilities sector.
Lastly, we broke out this market share data by region. As we discussed in Section 1 on Demographics, our regional data outside of North America and Europe & Central Asia do lack a large sample size, and should primarily be used for reference. Results are shown below.
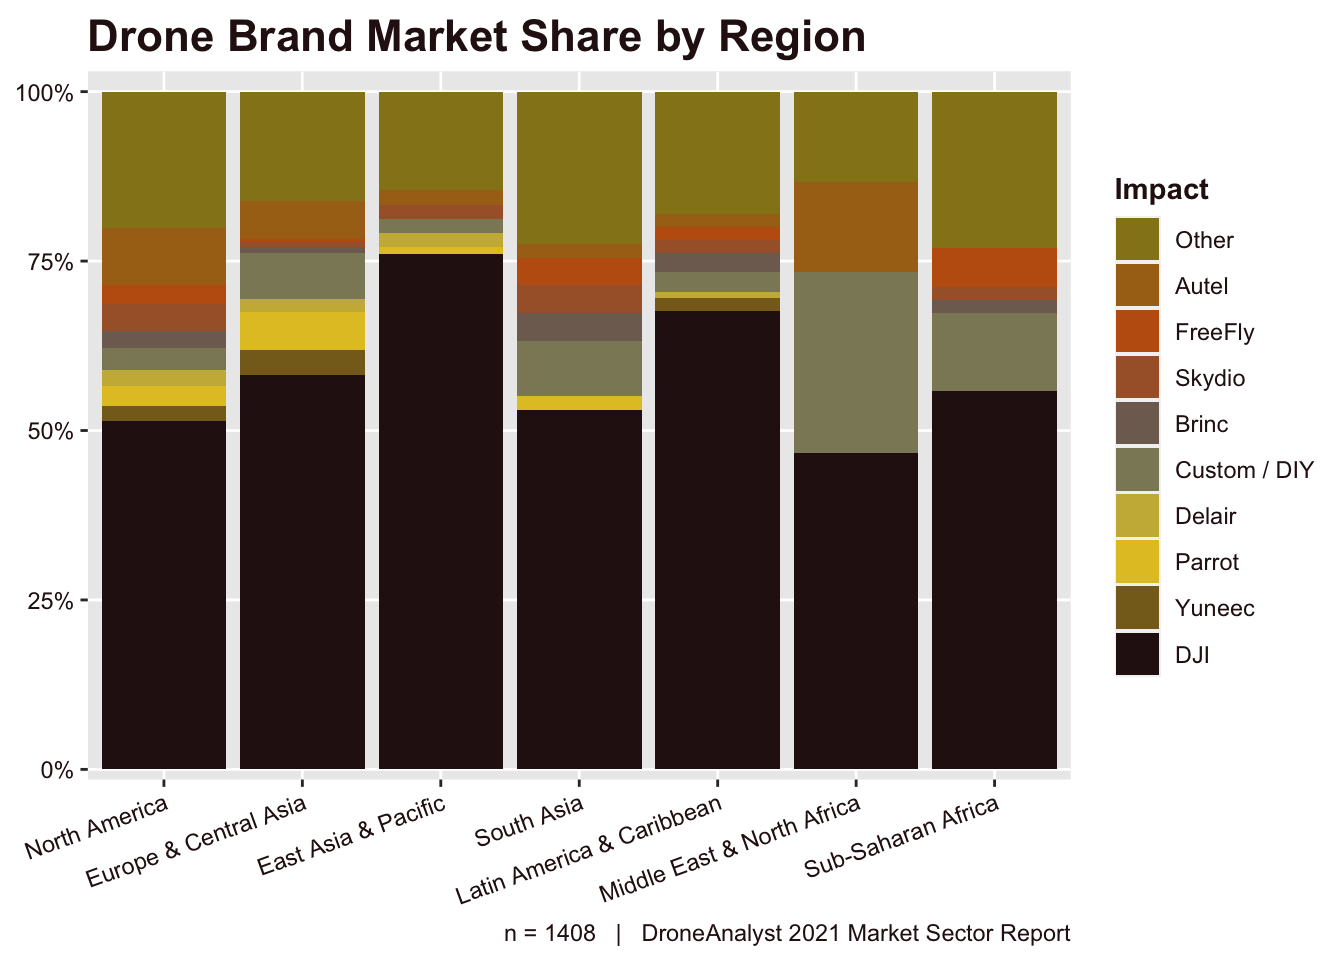
Figure 4.10: Drone Brand Market Share by Region
Starting with DJI, we see that their market share in Europe and East Asia have remained higher than that in the United States, as many new players have focused on the North American market due to supply constraints. Skydio is a great example of that, having only (entered Japan in November of 2020)[https://www.skydio.com/blog/skydio-grows-in-japans-enterprise-market/] and (Australia/ New Zealand in July of 2021)[https://www.skydio.com/blog/us-autonomous-drone-skydio-expansion-australia-new-zealand/]
Autel, which operates globally, has struggled to compete outside the US where it has more robust sales and marketing operations.
Parrot remains strong in Europe, where it is almost equal to Autel’s market share in second behind DJI, but is comparably weaker globally.
4.4 Price Points
We wanted to know the prices respondents paid for their most expensive drone purchases in the last 12 months. Figure 4.11 shows those results.
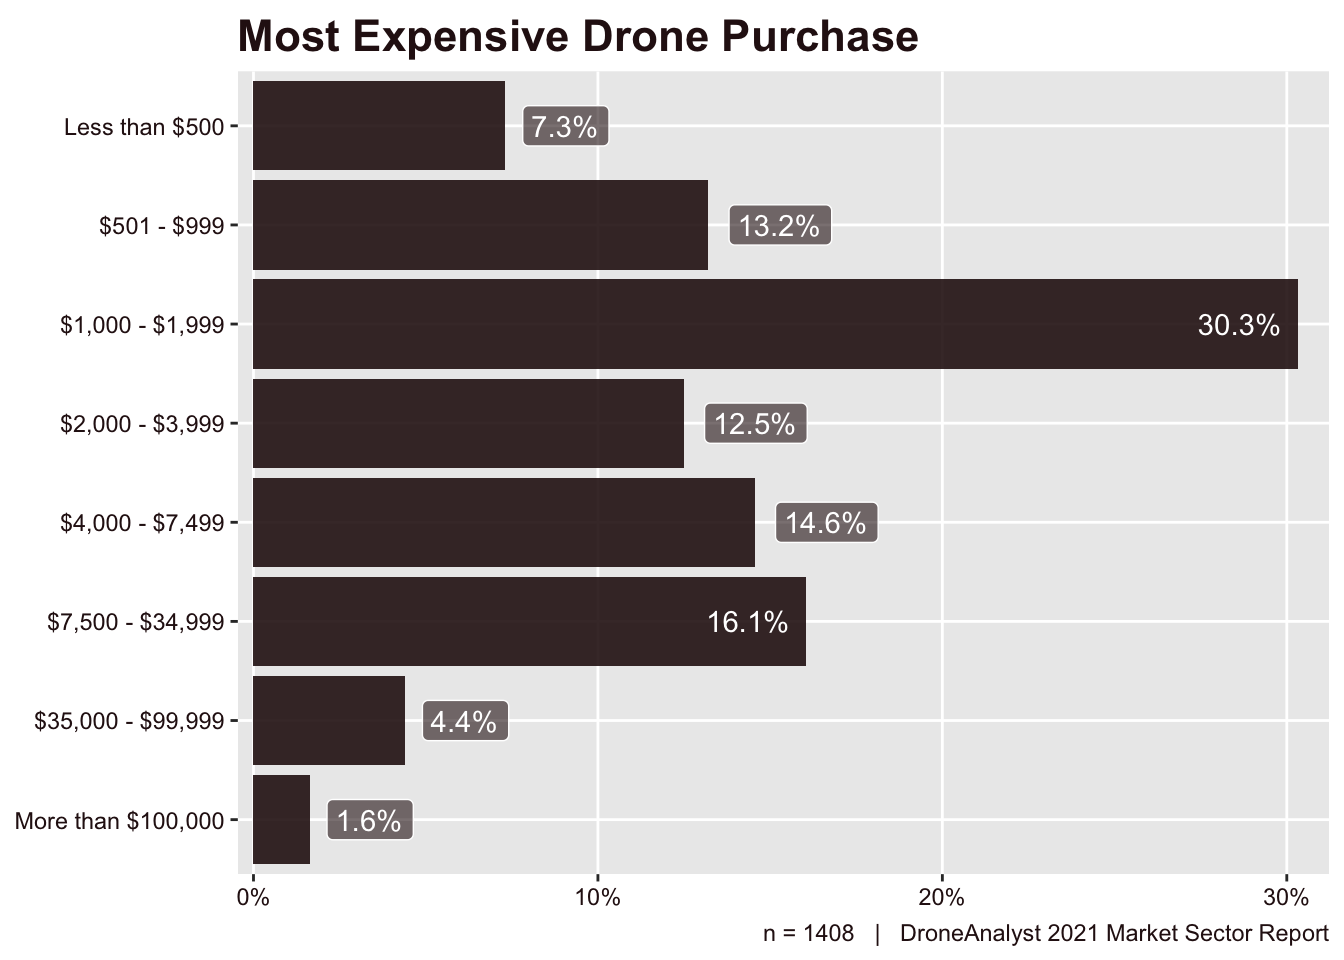
Figure 4.11: Most Expensive Drone Purchase
This year’s data shows a continuation of the shift we saw in 2018 towards more expensive models. In 2017, we saw one-third of buyers in our survey purchased drones costing less than $1,000. It has continued to drop to 27% in 2020 and is now at just 21%. This trend is more noticeable if you include all purchases below $2,000, which began at 78% of responses in 2017 and is now 51% in 2021. This drop has happened despite DJI lowering the prices on its consumer drone lines, reflecting our commercial-orientated respondents. We explore the relation behind price and use in Figure 4.13. We have explored overall consumer drone sales in our 2021-2026 Hardware Sector Report which uses customs data to get a better look at the consumer market.
Table 4.1 on the right shows how our median and average drone prices have adjusted over time. For all years, we have removed the highest and lowest price categories to not have our metrics skewed by these responses.
It is of course important to remember that our question asked specifically about their most expensive drone purchase, so this skews the data upwards for firms who bought large fleets of affordable drones and a single expensive airframe. This introduced error will be slightly increased this year when considering that drone types are getting diverse (Figure 4.4), with the types rising in popularity generally being more expensive than a traditional quadcopter.
This year marks the first time our media price range is $2,000 - $3,999 instead of $1,000 - $1,999. Similarly, we saw continued movement in our average drone price, which increased by $841.
Clearly, the market has shifted to higher-priced aircraft. Our data indicates that this is a result of more businesses and enterprises adopting and scaling drone programs, as well as more drone-based service providers and surveying, mapping, and GIS professionals opting for drones with better and more varied payloads.
| Year | Mean | Median |
|---|---|---|
| 2018 | 1718 | 1500 |
| 2020 | 8109 | 1500 |
| 2021 | 8950 | 3000 |
| DroneAnalyst 2021 Market Sector Report |
Just as we saw significant trends in drone types and brands across various sectors, we similarly wanted to assess the variation in most expensive drone across sectors. Particularly, we have seen industries like Public Safety work around specific price ranges where purchases can be made with minimal approval.
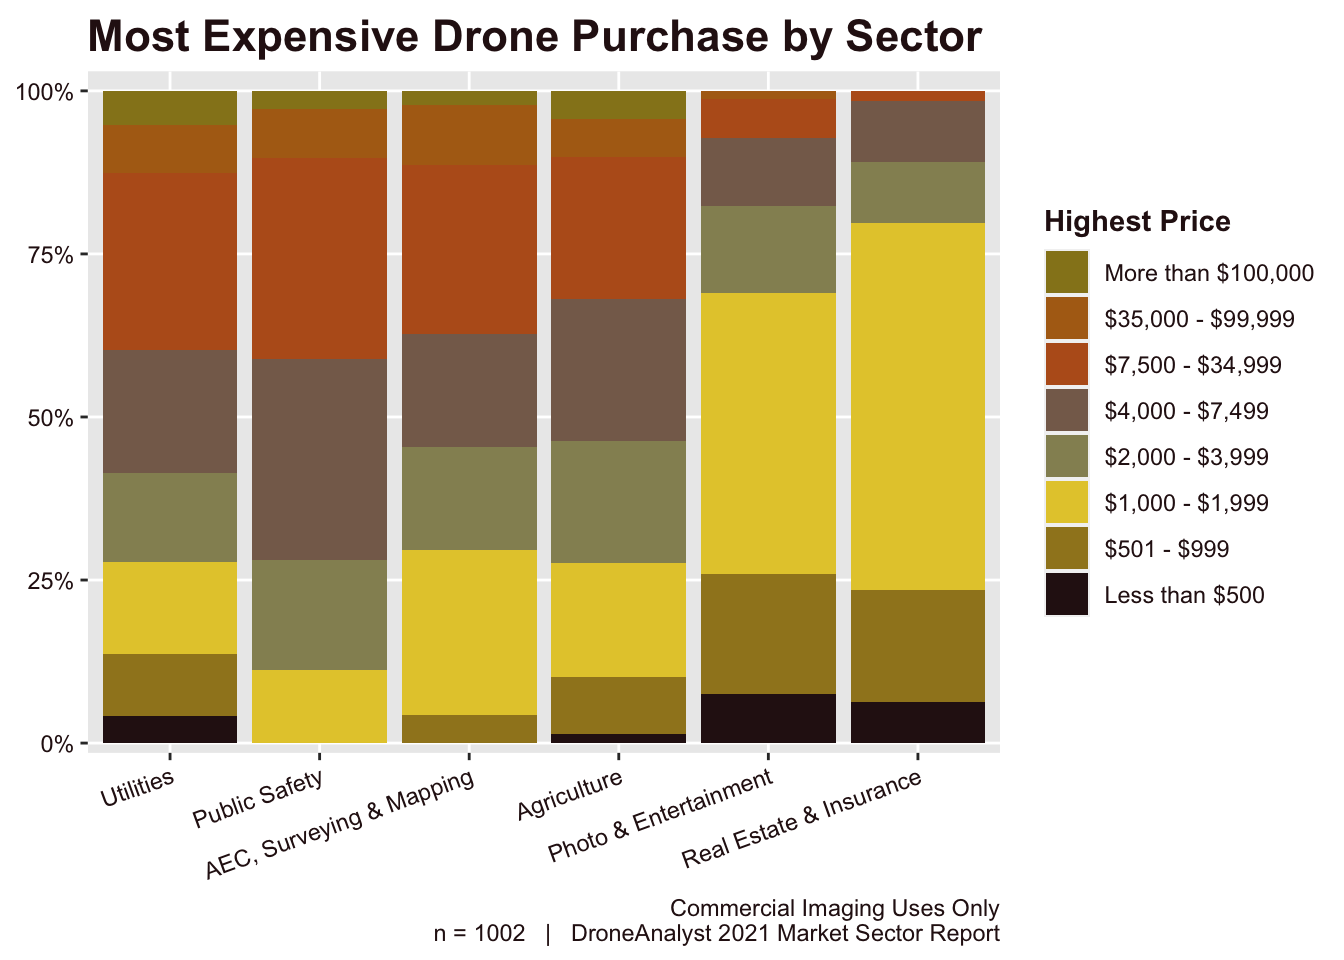
Figure 4.12: Most Expensive Drone Purchase by Sector
One great way to immediately interpret this chart is to look at what price the 50% marker denotes across each industry, as this shows the median range for this sector. The big differentiator here are the more creative applications like Photo & Entertainment and Real Estate & Insurance that emphasize regular photos of videos as their output, versus other applications which rely on real-time inspection data or sophisticated deliverables like a point cloud.
Each year we have analyzed price points by ignoring the concept of a “consumer”, “prosumer” or “enterprise” drone and instead looked at the specific use that buyers purchased the drone for. We have broken these uses into three broad categories (Commercial Imaging, Academic & Other and Hobby) as delineated in Figure 4.1. We display our key findings in Figure 4.13 below.
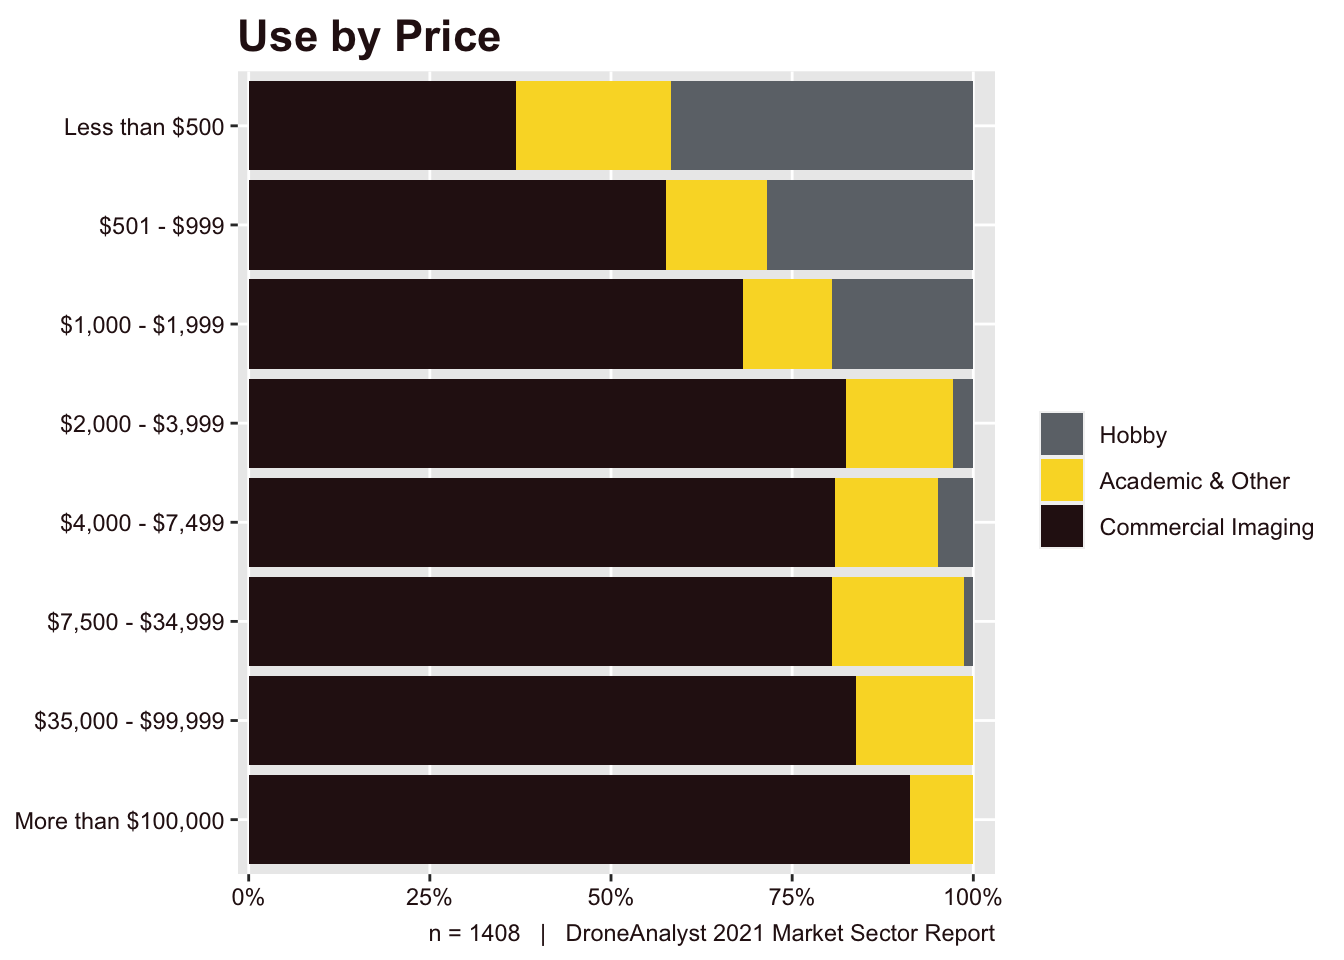
Figure 4.13: Use by Price
We should note that “prosumer” is—as we have defined it historically as the $501 - $999 price range—a very narrow category, and that the majority of buyers in this category purchase their drones with either civil/commercial or public/governmental use in mind.
There is some difference in the results we see this year versus last year. For example, last year the $1,000–$1,999 range had 79% of respondents saying they bought for commercial/academic use. This year we find that 82% say that. This increase—and the increase in the proportion of respondents buying aircraft priced between $500 and $2,000 for commercial/professional purposes—indicates just how much the market is moving from consumer to professional.
This reflects our (broader hypothesis)[https://droneanalyst.com/2021/04/28/how-large-is-the-drone-market] that the consumer drone market, which is to say any drone purchased solely for hobby use, has hit its saturation point. That being said, we expect to see the “prosumer” segment of hardware continue to exist and be purchased for professional use.
4.5 Purchase Channels
One of our objectives again this year was to learn buyers’ preferred place of purchase (channel outlet) and note any differences from the previous year’s data. We asked where they or their organization obtained their drone. As we mentioned earlier in this report, we have written publicly about the (shifts in channel policy made by DJI)[https://droneanalyst.com/2021/03/16/drone-channel-mayhem-dji-rewrites-the-rules] and their broader impact. The answers appear in Figure 4.14.
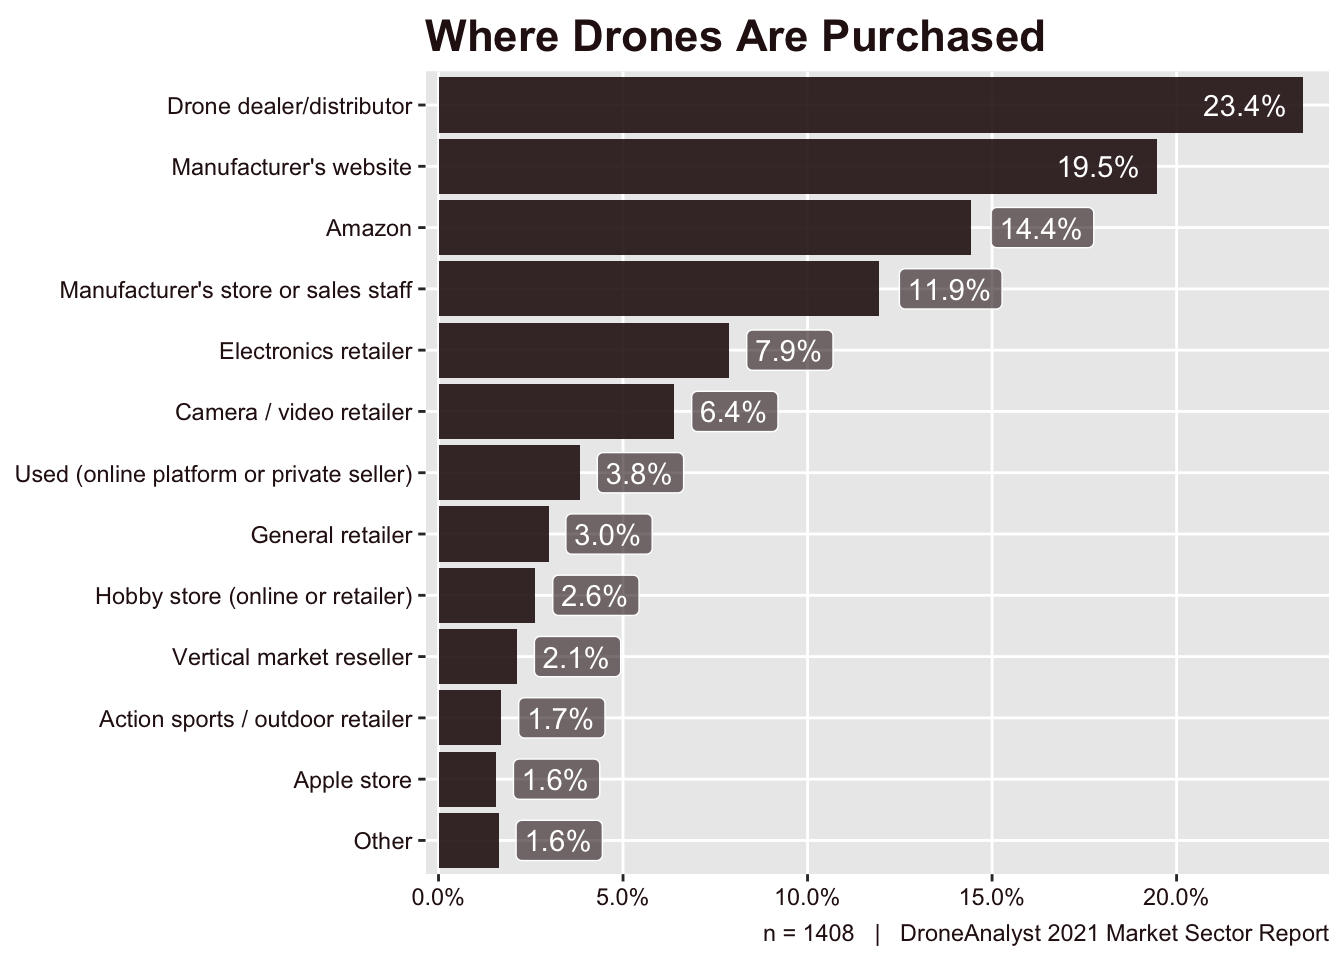
Figure 4.14: Where Drones Are Purchased
This year we saw a much more diverse range of purchase channels, with four channels selected by over 10% of respondents each, compared to just two in 2020. Despite this shift to more diverse places of procurement, Drone Dealer/Distributor remains at the top, with Manufacturer’s Website close behind.
The place of purchase has changed significantly over the years, and has large differences depending on the sector of the buyer, so we have looked into these two questions in the following two figures.
Figure 4.15 looks at how this has changed over the years.
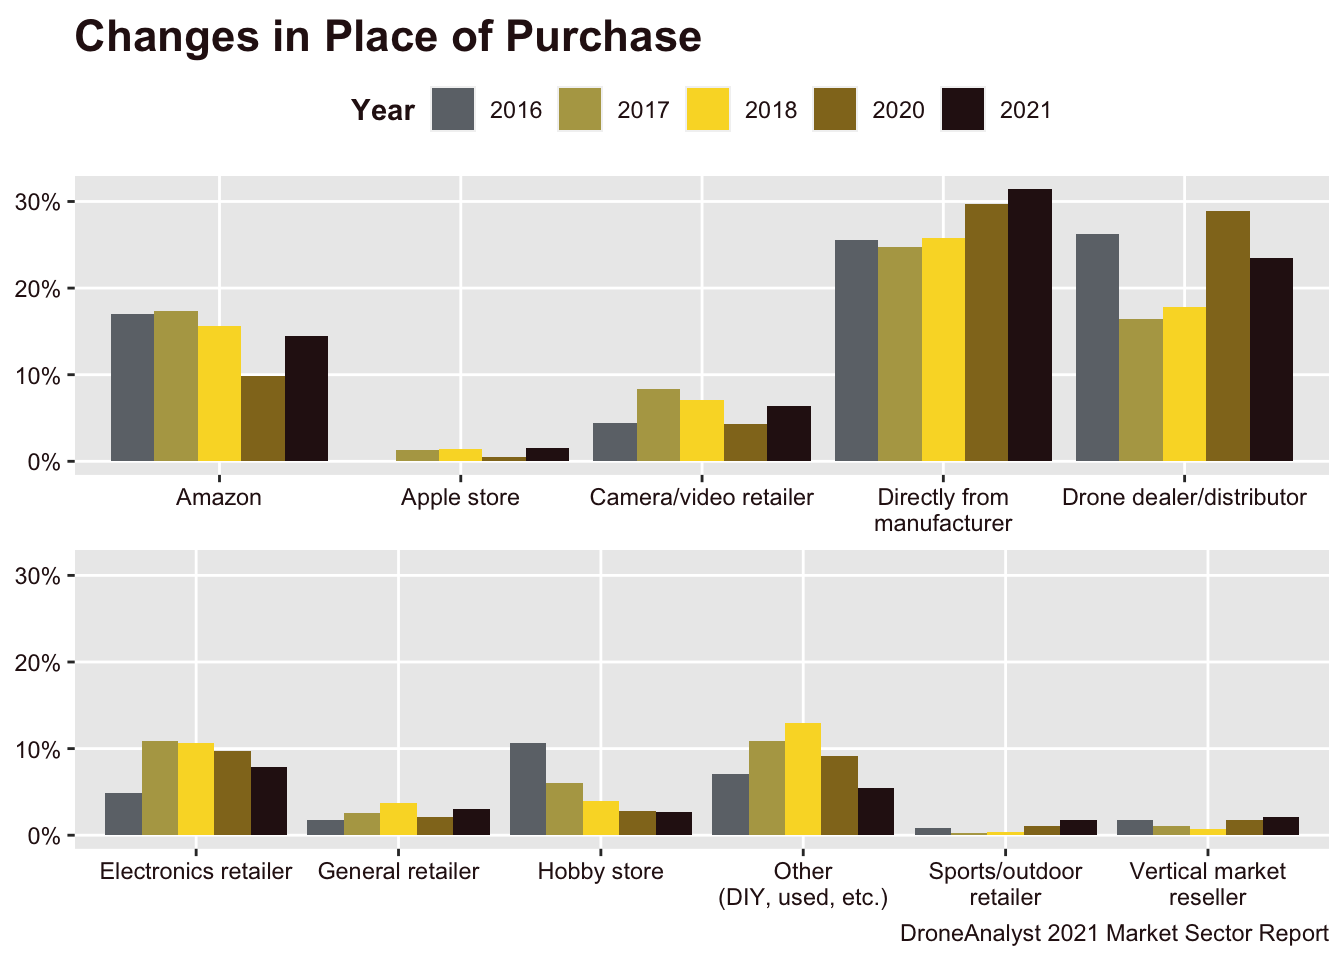
Figure 4.15: Changes in Place of Purchase
The key area of this figure to focus on is the top right, where Direct from the Manufacturer has jumped to 8 points above drone dealers. This is despite a small, 1-point drop from the manufacturer’s website, with manufacturer’s sales staff jumping nearly 3-points compared to in 2020. We suspect this shift is primarily due to the rise of other manufacturers outside DJI. As these brands move to find their place in the industry a few (like Skydio) have refrained from enlisting many drone dealers as a strategic choice, while others simply need to have their own sales force to compete.
Lastly, we looked at how answers to this question varied by the sector of the respondent (Figure 4.16). We saw huge differences across most sectors, but most starkly between Photo & Entertainment and Real Estate & Insurance against the rest.
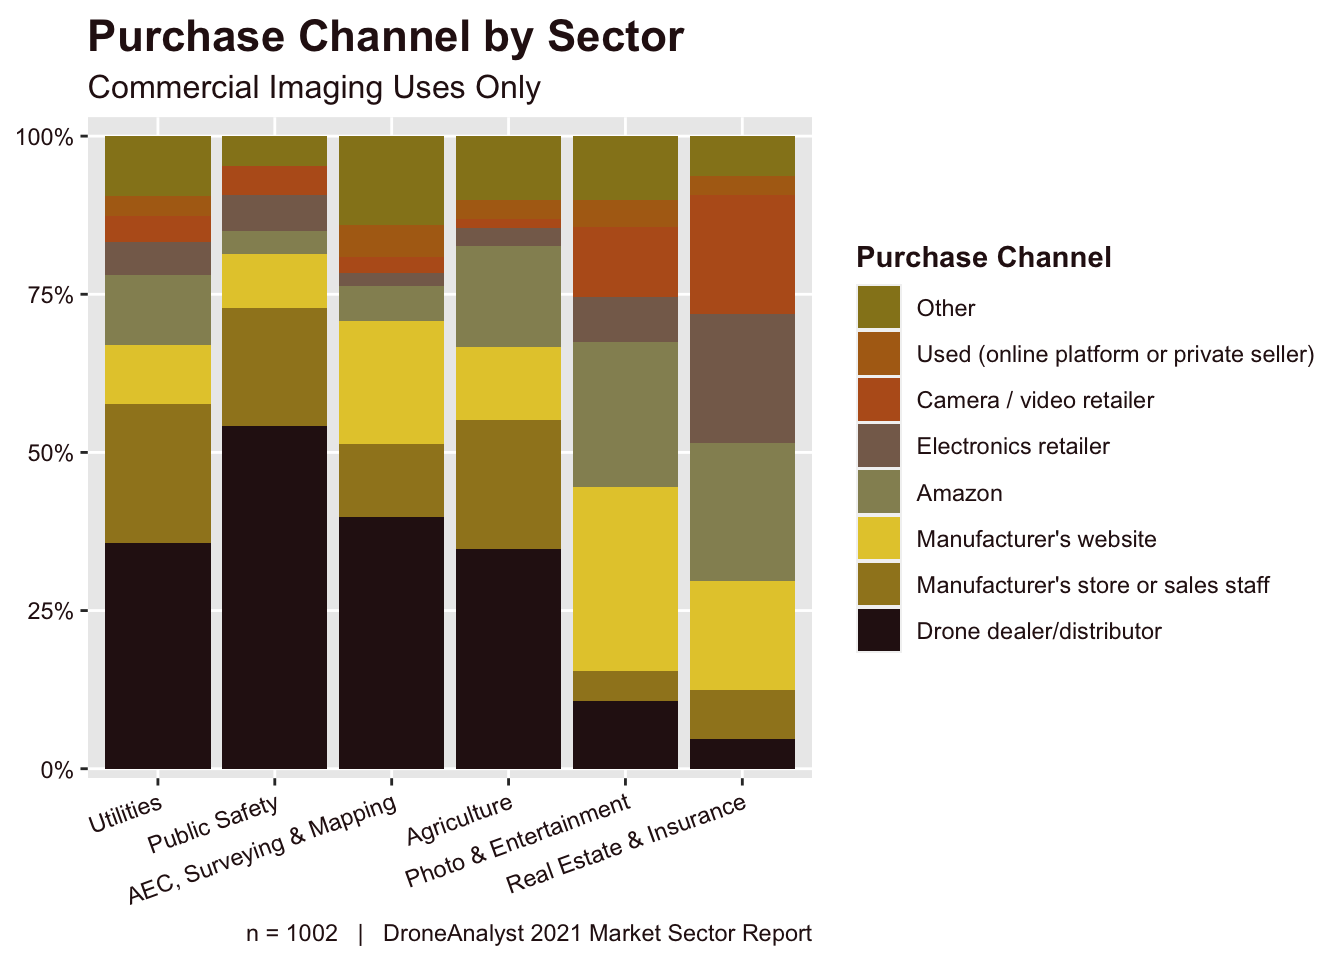
Figure 4.16: Purchase Channel by Sector
Online platforms like Amazon and Manufacturer’s website were used less frequently among core enterprise sectors like Utilities, Public Safety, AEC, Surveying & Mapping and Agriculture.
In these same sectors, drone dealers outperformed the rest. Most notably, drone dealers made up more than 50% of drone sales among the public safety sector. This is likely due to procurement rules around competitive bids in these organizations, but also the additional assistance drone dealers can provide to these relatively small, but sophisticated organizations.
4.6 Payloads
As part of our research, we wanted to know the most popular cameras and sensors used on drones. First, we asked a qualifying question about the integration of the camera or sensor that came with the respondents’ most recent drone purchase. Figure 4.17 shows the results.
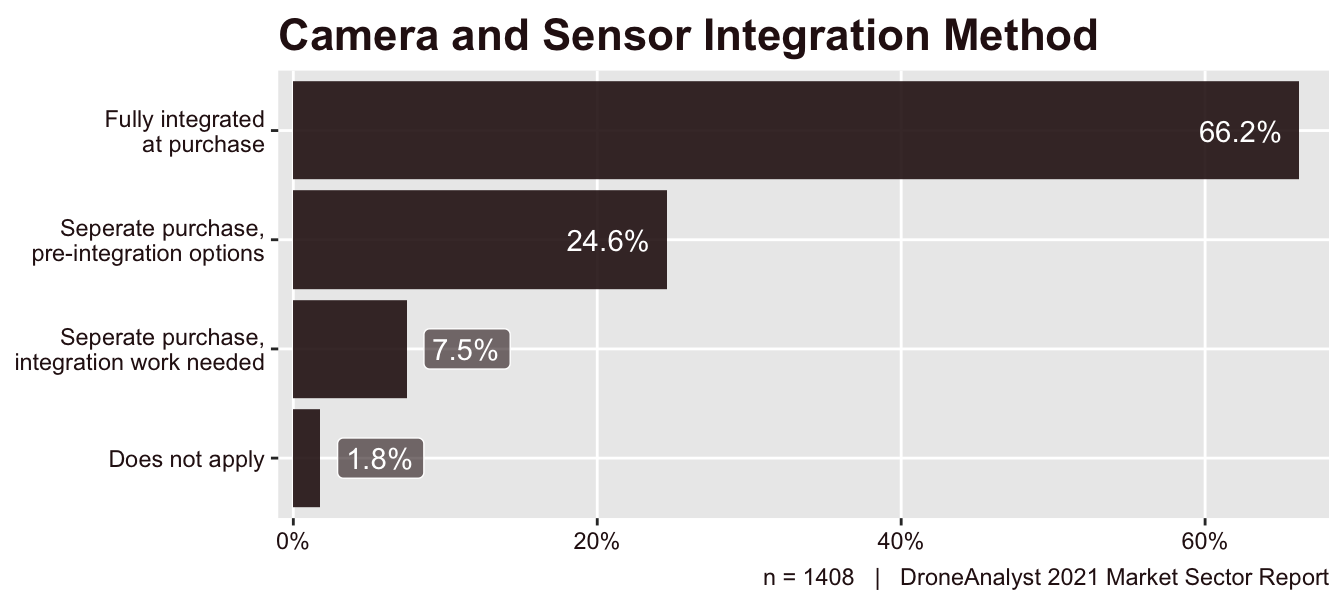
Figure 4.17: Camera and Sensor Integration Method
Again this year we were not surprised that “fully integrated” got the most responses (66% of purchases), since all of the leading manufacturers have drones with cameras already pre-installed on them. However, as we have seen in our earlier findings around drone types (Figure 4.4) and drone brands (Figure 4.6), the market is becoming more diverse and hardware is getting more sophisticated. This is reflected by “fully integrated” purchases dropping 12 points from 2020, where it made up 78% of purchases, with a 9 point bump among payloads that were a “separate purchase, with pre-integration”.
This primer question is a general look at the market, but what we really wanted to know was what types and brands of camera were used when they were an add-on purchase, since this can be a signpost for new trends in the higher end of the market. With our new methodologies this year, we are also able to see how these trends have shifted based off of industry section.
Participants could check more than one option for both sensor type and brand, since some drones allow multiple cameras. The answers for types of cameras/sensors appears first in Figure 4.18.
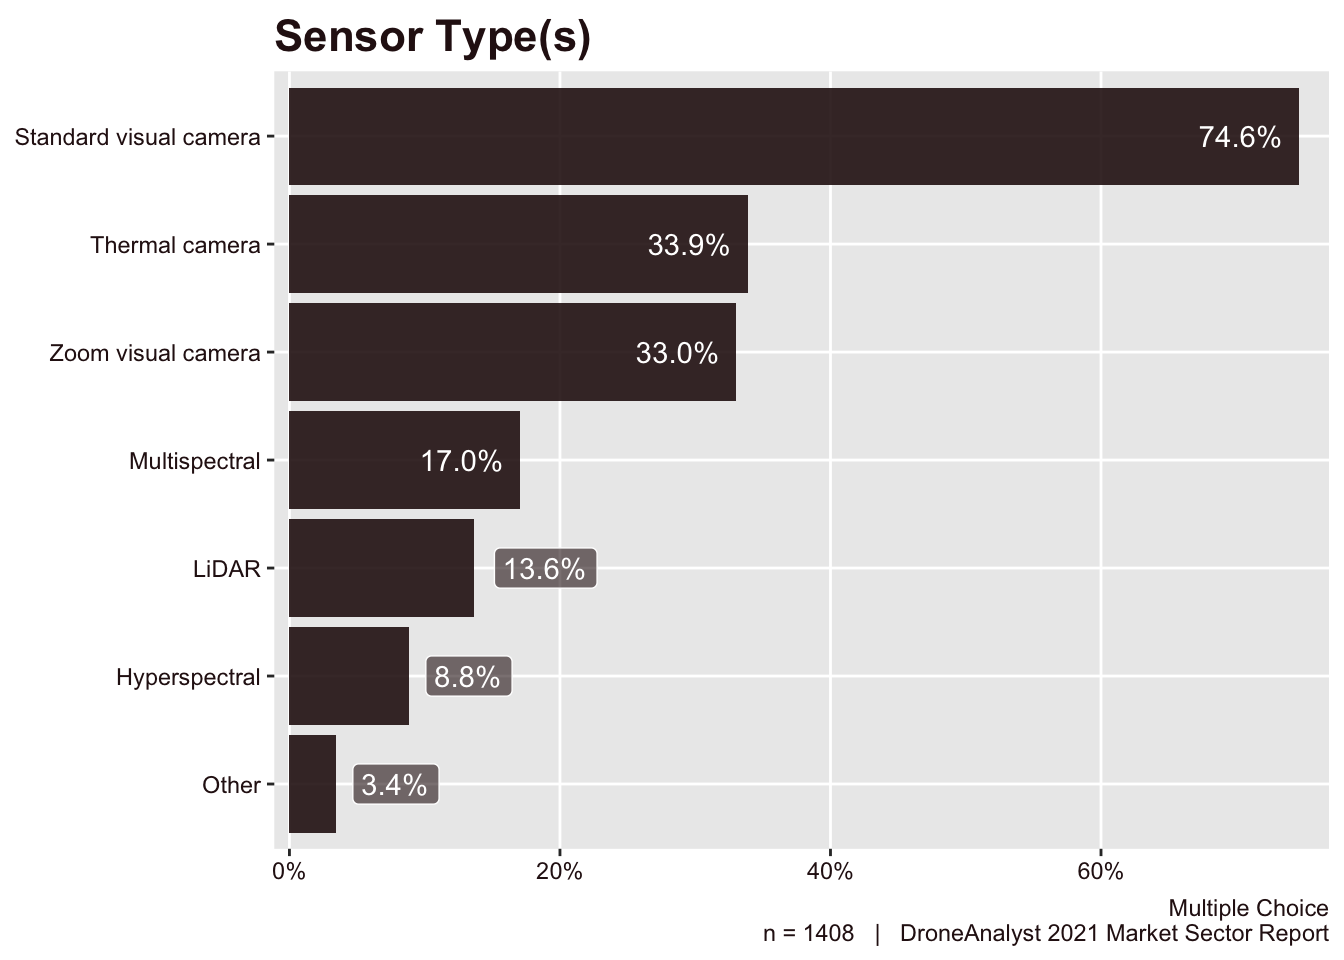
Figure 4.18: Sensor Type(s)
As expected, we saw that the vast majority (75%) of all sensors equipped or added on to a drone was a standard visual camera. This was followed by thermal cameras at 34%, which are most commonly used for public safety and inspection applications. In the survey, we specified that zoom visual cameras meant 30x zoom or higher, and were not surprised to find that this ranked just below thermal cameras at 33%. We similarly see this type of payload most common in public safety and inspection applications – so much so that many individual payloads now integrate a thermal and a visual zoom camera side by side.
We saw the dominance of visual sensors drop by 12 points as customers turn to more diverse sensors. We also found that generally, our survey respondents purchased more types of payloads on average. In 2020, the average drone buyer purchased 1.6 types of sensors, and that is now at 1.8 in 2021.
This increased diversity saw all payload types outside of visual cameras increase. The most notable growth was among hyperspectral cameras, which jumped from just 2% in 2020 to 9% today.
Just as we explored how the type of drones purchased changed across key sectors, we similarly wanted to explore how sensor types vary. This is displayed below in Figure 4.19.
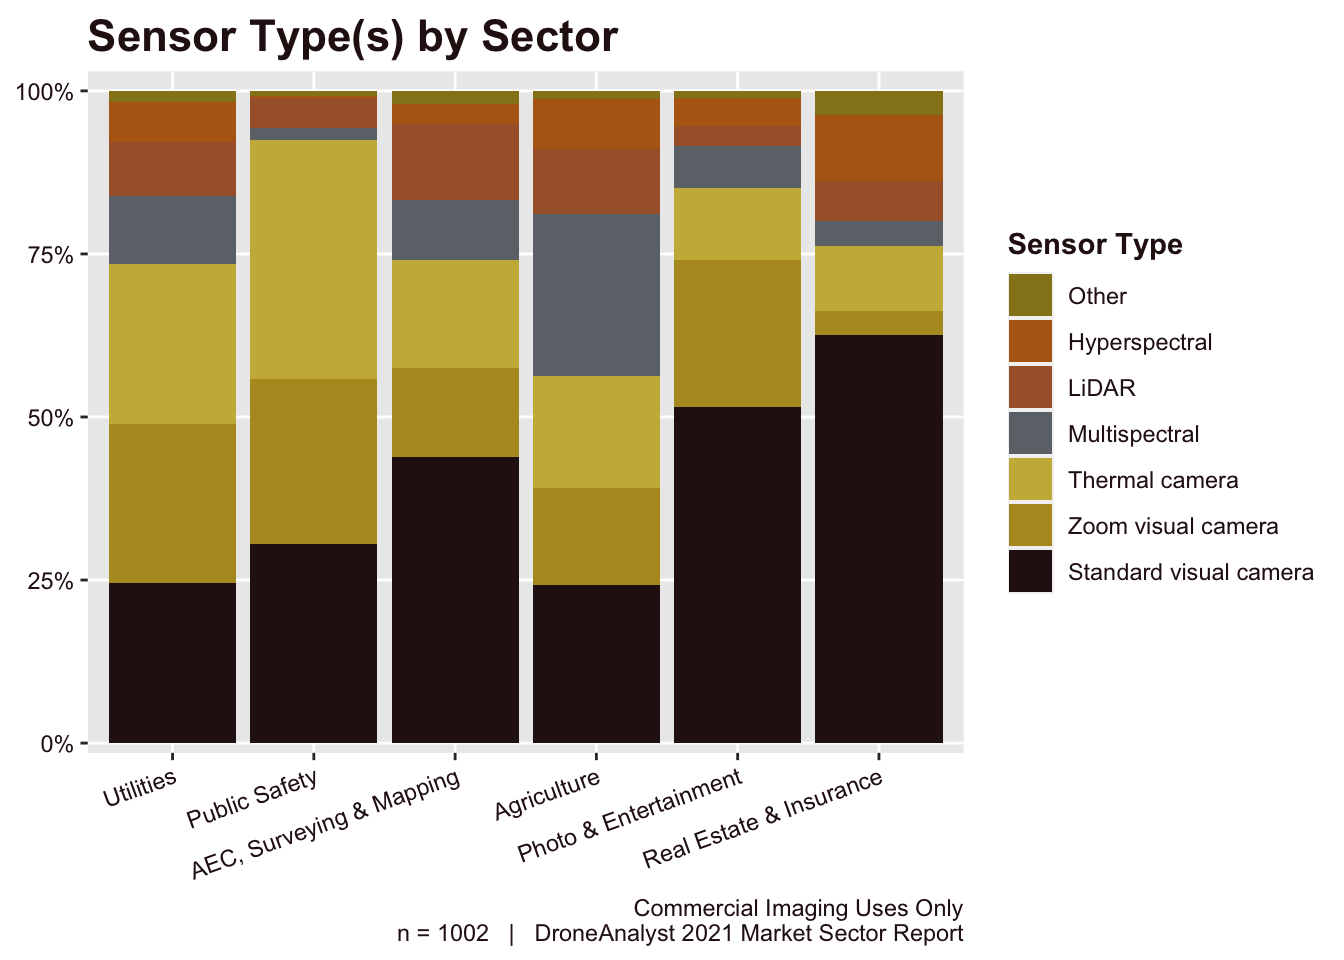
Figure 4.19: Fig 18: Sensor Type by Sector
There is a lot of time that we can spend on this chart, as the sensor chosen says quite a lot about the deliverable a customer is looking for. The strong presence of multispectral cameras in the Agriculture sector is a perfect example of that, as these cameras can better estimate plant health than a traditional visual camera can. We also see LiDAR rising particularly in the Utilities and AEC, Surveying and Mapping sectors.
Lastly, the Public Safety sector is interesting due to their deep focus on thermal and visual sensors. We have noted before that many of the new ecosystem of US manufacturers have dialed in on this core tactical thermal and visual imaging drone for Public Safety. This data suggests that this focus makes sense considering that highly focused need within this sector.
After asking respondents about the type of sensors they purchased, we also asked them about what specific brands they purchased. Since this represents a market-of-markets (i.e a LiDAR payload is not competing with a thermal sensor), we have chosen to represent this data first as a pie chart to view market share leaders and later as a treemap grouped by payload type. First below we have visualized the data as a pie chart of top responses in Figure 4.19, correcting for multiple choice responses to keep the total 100%.
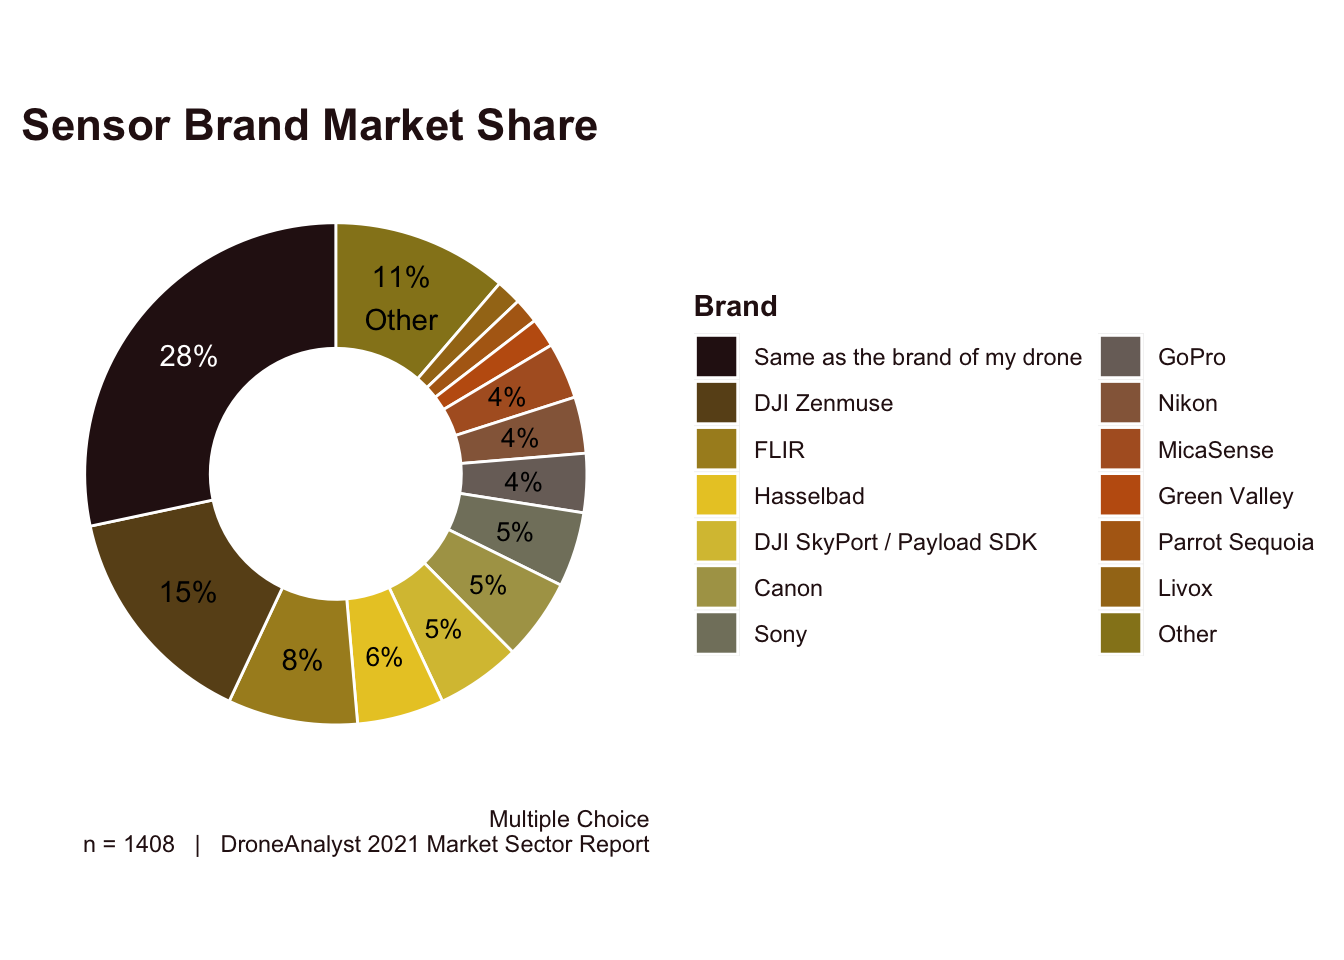
Figure 4.20: Sensor Brand Market Share
With 65% of responses of “same as the brand of my drone” being DJI drone buyers, DJI’s total market share (including its own brand and those under its SkyPort program) of all cameras or sensors attached to drones is 37.6%. This is slightly higher than our 2020 data which showed DJI’s combined market share at 34.5%.
DJI Zenmuse branded payloads were themselves the largest purchased brand of add-on payloads. Similarly, we saw a 6-point drop on FLIR’s overall market share this year (from 12% in 2020 to 8% today). Combined, this reflects DJI’s move away from FLIR sensors for its aircraft (both its large M300 RTK platform and integrated Mavic 2 Enterprise Advanced drone).
DJI SkyPort / Payload SDK continues to be the only true standard for payload development, buoyed by the success of DJI hardware itself. However, we don’t see much new adoption on this platform overall
When we remove responses such as “same as the brand of my drone”, “DJI Zenmuse” and “DJI SkyPort” we can paint a clearer picture around what payload developer brands and types of cameras are most being purchased by the higher end market. This is displayed below in a treemap graph grouped by the type of sensor the brand makes.
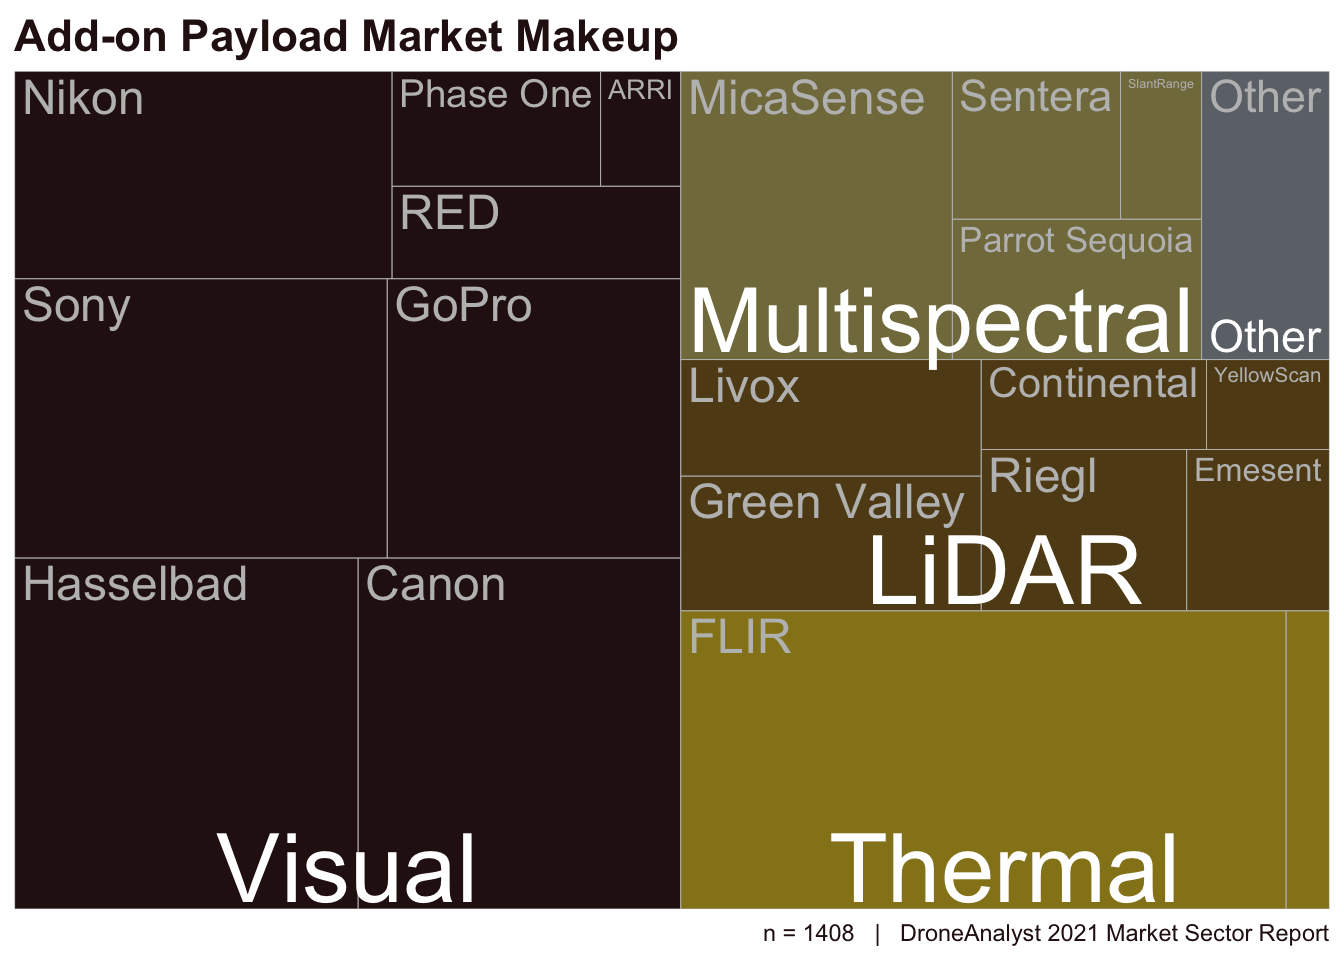
Figure 4.21: Add-on Payload Market Makeup
Looking at the data through this angle, we can see that most sub-markets of the payload industry are dominated by a few players. FLIR is the most obvious, with a 93% share of the thermal market. However, FLIR’s share is overstated here, as although they dominate the OEM space by quantity of brand partners, DJI’s move to other thermal core suppliers means their market share is much lower overall.
Similarly, MicaSense also makes the Parrot Sequoia, so although they are no longer owned by Parrot, we can still count their market share together. Combined, MicaSense has a 75% share of the multispectral imaging market, just 1 point off their 2020 share.
The LiDAR and Visual sensor markets are more competitive, with the LiDAR market still being relatively immature and the Visual sensor market dominated by traditional cameras brands.
4.7 Additional Mounted Accessories
As drone operations have matured, we are seeing drones carrying other accessories that do not come pre-installed on the drone and do not fit neatly into the camera/sensor category. They generally fit into two broad categories: (1) enabling advanced operations such as flight at night or above people and (2) conducting missions where manned missions are unsafe. We asked respondents what mounted accessories (if any) they mount in and allowed respondents to write in their own response if needed. This is the second year we asked this question, and added a few additional options such as parachutes and prop guards that are specific to operations over people. You can view the findings from this question in Figure 4.22 below.
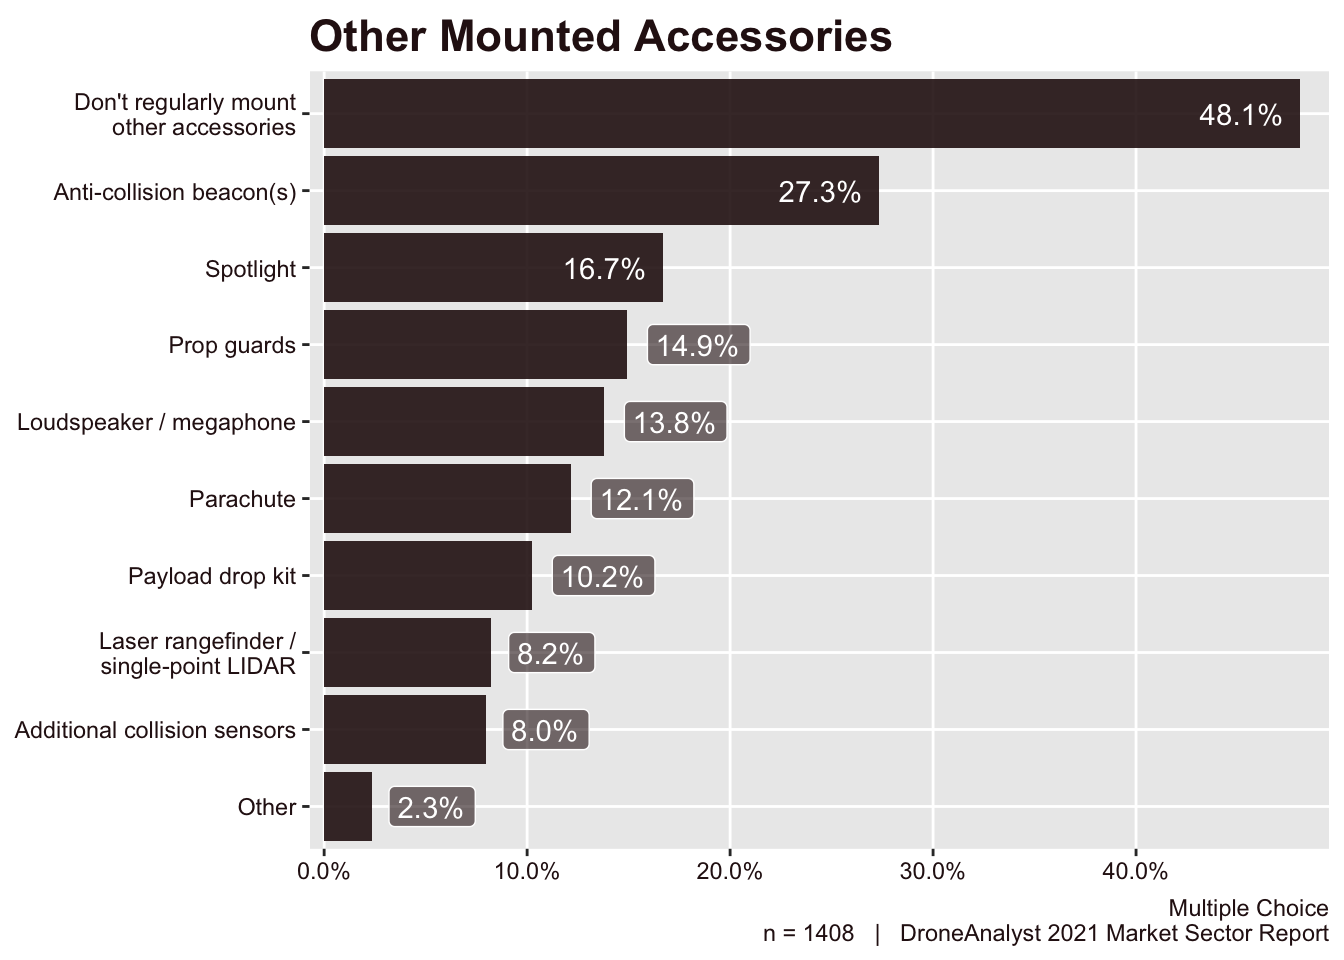
Figure 4.22: Other Mounted Accessories
Overall, we saw a large uptick in the adoption and use of mounted accessories. Whereas in 2020 we saw roughly one-third (36%) of respondents using such an accessory, that has increased to over half (52%) today.
Anti-collision beacons were the most used accessory in 2020, and remain the leader in 2021. However, they have jumped from just 16% of all drones to over one-fourth (26%). This large uptick reflects eased rules around low light flights, and that many drones are now coming with anti-collision beacons pre-installed.
Parachutes have been critical in enabling operations over people waivers in the past, and may be critical for the new rules set in place by the FAA at the end of 2020. However, no drone has gone through that rigorous process quite yet. Despite this, parachute’s are already ranking as the fifth most used accessory today.
Many mounted accessories tend to be specific to a particular sector of the market, so we have explored that relationship further in Figure 4.23 below.
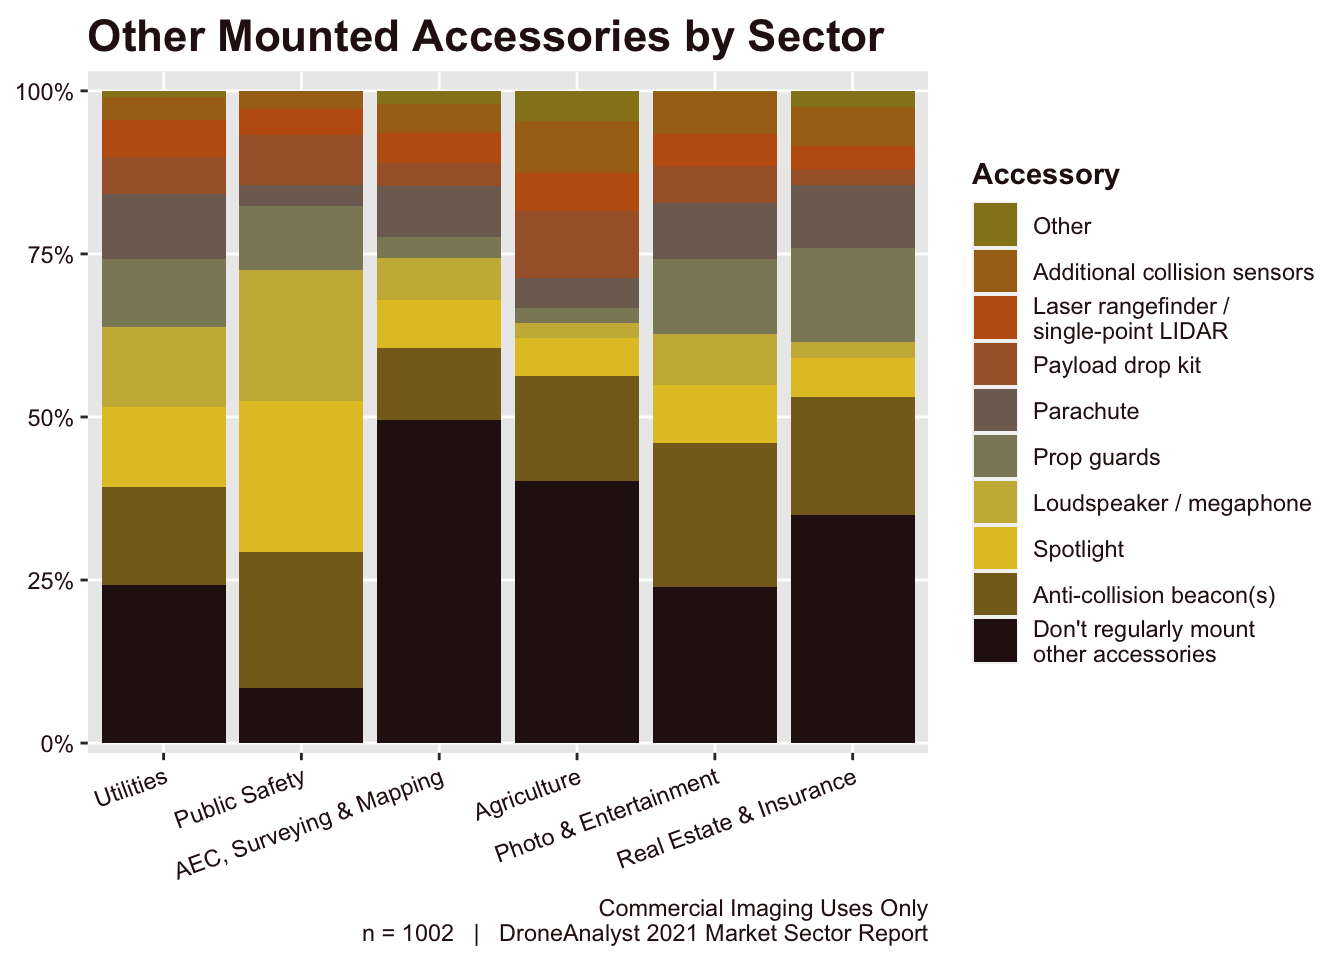
Figure 4.23: Other Mounted Accessories by Sector
Public Safety organizations are the largest adopters of mounted accessories, relying heavily on tactical tools like spotlights, loudspeakers, and even payload drop kits. We have seen this sector be the most “DIY” of all as agencies tend to have small budgets but the willingness to tinker. This has seen public safety adopt these accessories well before they were productized, with some high-profile stories behind their usage. Today, drones like the DJI Mavic 2 Enterprise and Brinc Lemur have been conceived to bring public safety focused accessories into the core identity of the product.
News and entertainment have had several high-profile operations over people waivers, and this is reflected slightly in the data, as this sector has a higher relative adoption of anti-collision beacons, parachutes and prop guards - all critical for such operations.
4.8 Purchasing Decision Factors & Security Requirements
We asked two questions to understand customers’ priorities when purchasing drones: the first explored the three main decision factors behind a purchase while the second offered a list of common security requirements and asked respondents which are absolutely necessary for a product to have before they make a purchase.
As we have seen increased players in the hardware market, these questions and their answers, are critical to understanding how these new players will be able to compete in the marketplace. For example, we have seen many new US manufacturers emphasize country of origin and security requirements in their marketing. These claims are not as prominent as last year, as more defined federal rules and a new FTC approach to enforcement have come to better inform the market, and many of these products still rely on Chinese-made components.
Additionally, we have seen Skydio emphasize autonomy as a core part of its brand and value proposition, which has caught a lot of attention and discussion among drone pilots and industry stakeholders. While we see automation as a long term factor driving the industry, our 2020 survey did not find that it drove many purchases. We have written extensively about the hype and status of drone autonomy.
We break down responses to the first question on primary purchases factors below in Figure 4.24.
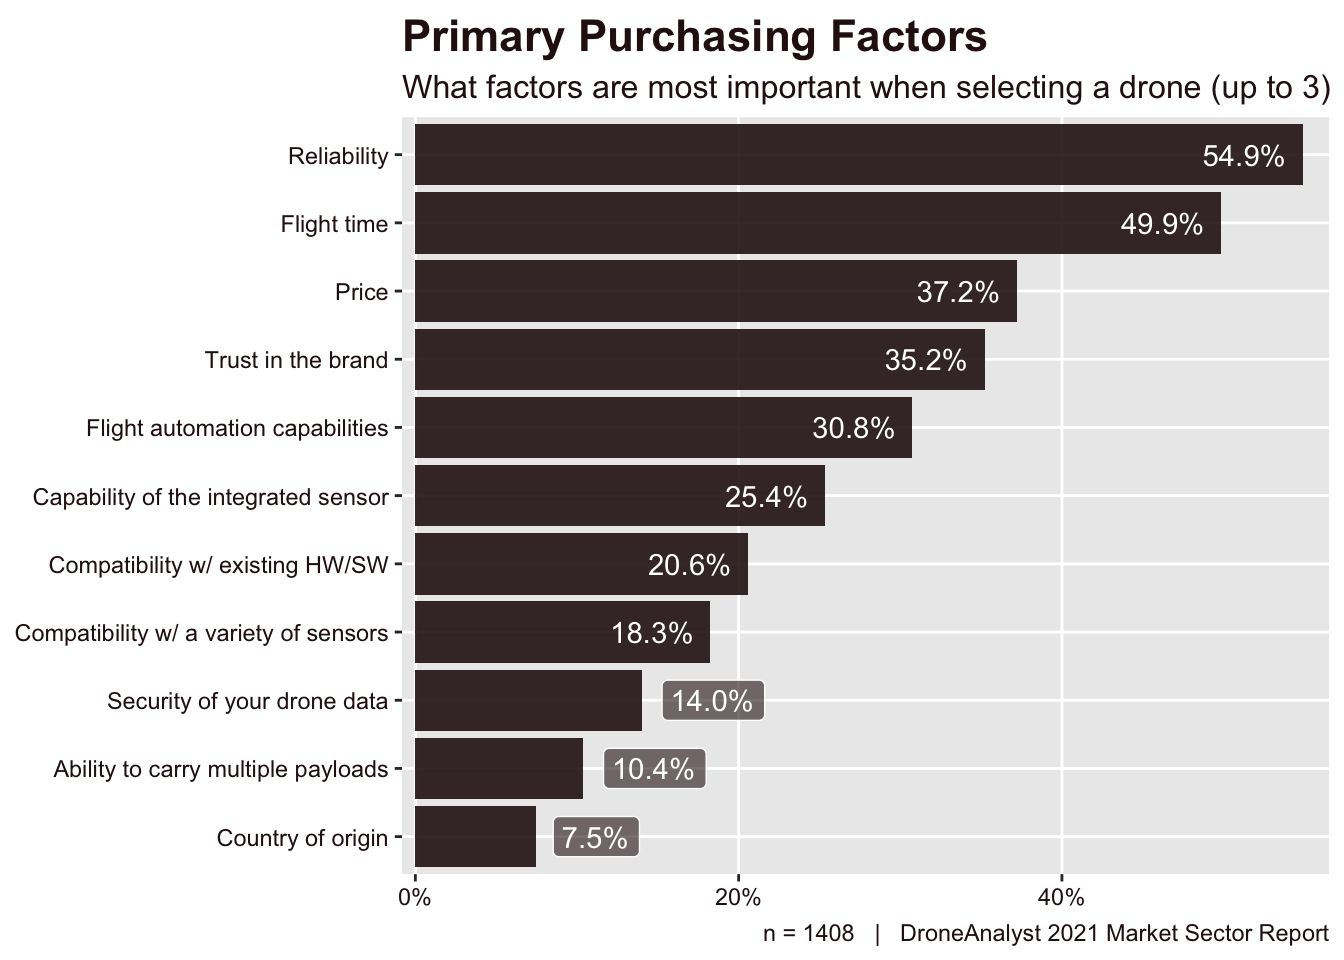
Figure 4.24: Primary Purchasing Factors
The most obvious decision factors – reliability, flight time and price – dominate the purchasing factors with flight time and reliability selected by roughly half of all respondents. The fourth most selected – trust in the brand – was more surprising as it ranked above many performance-oriented factors and was 2% behind price. This likely has much to do with much of the vaporware the drone industry has seen, as many brands have made big promises and have failed to deliver.
The results from this year’s survey were identical in priority as those in 2020, but there are a few changes worth noting. The first is that the dropoff in this year’s purchasing factors was much more gradual and diverse. For example, in 2020 only 5 factors were selected by more than 20% of respondents. In 2021, there are now 7.
The factor with the largest absolute gain this year was the capability of the integrated sensor, followed by compatibility with a variety of sensors. As more drone hardware enters the market, it makes sense for payloads to be a key differentiator.
Interestingly, the largest proportional increase in selections was also the least chosen, Country of Origin, which rose by 3 points (+74%). While Country of Origin is not the leading purchasing factor, with new proposed regulations at the federal and state in the US, it is not surprising to see it rise.
We explored the relationship between respondent’s primary purchasing factors and their industry sector last year, and are excited to dive deeper through a specific figure detailing these findings this year. This relationship is explored below in Figure 4.25.
While the respondents selected three primary factors, the figure below calculates the responses selected proportionally out of 100%. In effect, every factor was selected by 3x that amount of unique respondents. Take for example Utilities and Reliability. The figure shows that roughly 13% of responses had included reliability, meaning that 39% of all buyers in the Utilities sector consider Reliability as one of their three primary purchasing factors.
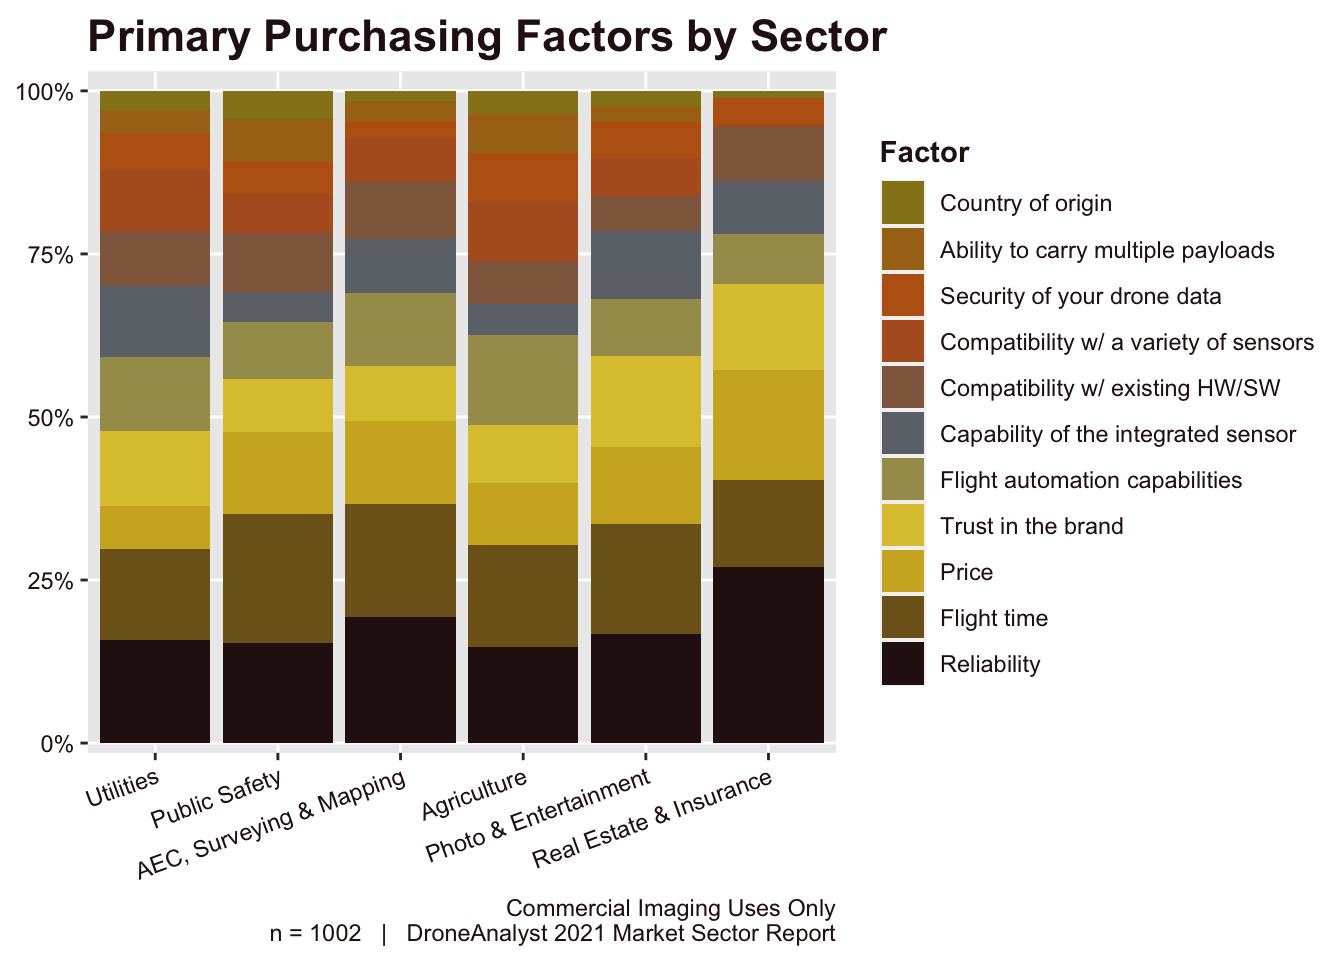
Figure 4.25: Primary Purchasing Factors by Sector
There is a lot to dig into here, so we’ll highlight just a few, and let you explore this chart in more detail. First, a valuable way to read this figure is to start by looking at the proportion of respondents above Price. The size of this section can also be interpreted as the “diversity” of purchasing factors within a particular sector. Since Utilities and Agriculture have the first 4 factors account for a smaller portion of respondents, we can find that their requirements tend to be more diverse. By comparison, 70% of factors driving purchases in the Real Estate & Insurance sector are related to the 4 basic factors - reliability, flight time, trust in brand and price.
Buyers in the Utilities sector have a larger emphasis on the sensor’s capability and compatibility with various payloads. Customers in the Agriculture and Utilities market are also most likely to emphasize flight automation capabilities.
The concern around country of origin was highest among respondents in Public Safety (12%), Agriculture (11%) and Utilities (10%). These metrics are out of unique responses of buyers in those sectors.
Next we asked respondents about which security features are necessary for them to have before they purchase a product. Respondents could select several features and also had the option to select Other and write in their own response, although nearly no respondents chose this option. The results are displayed in Figure 4.26.
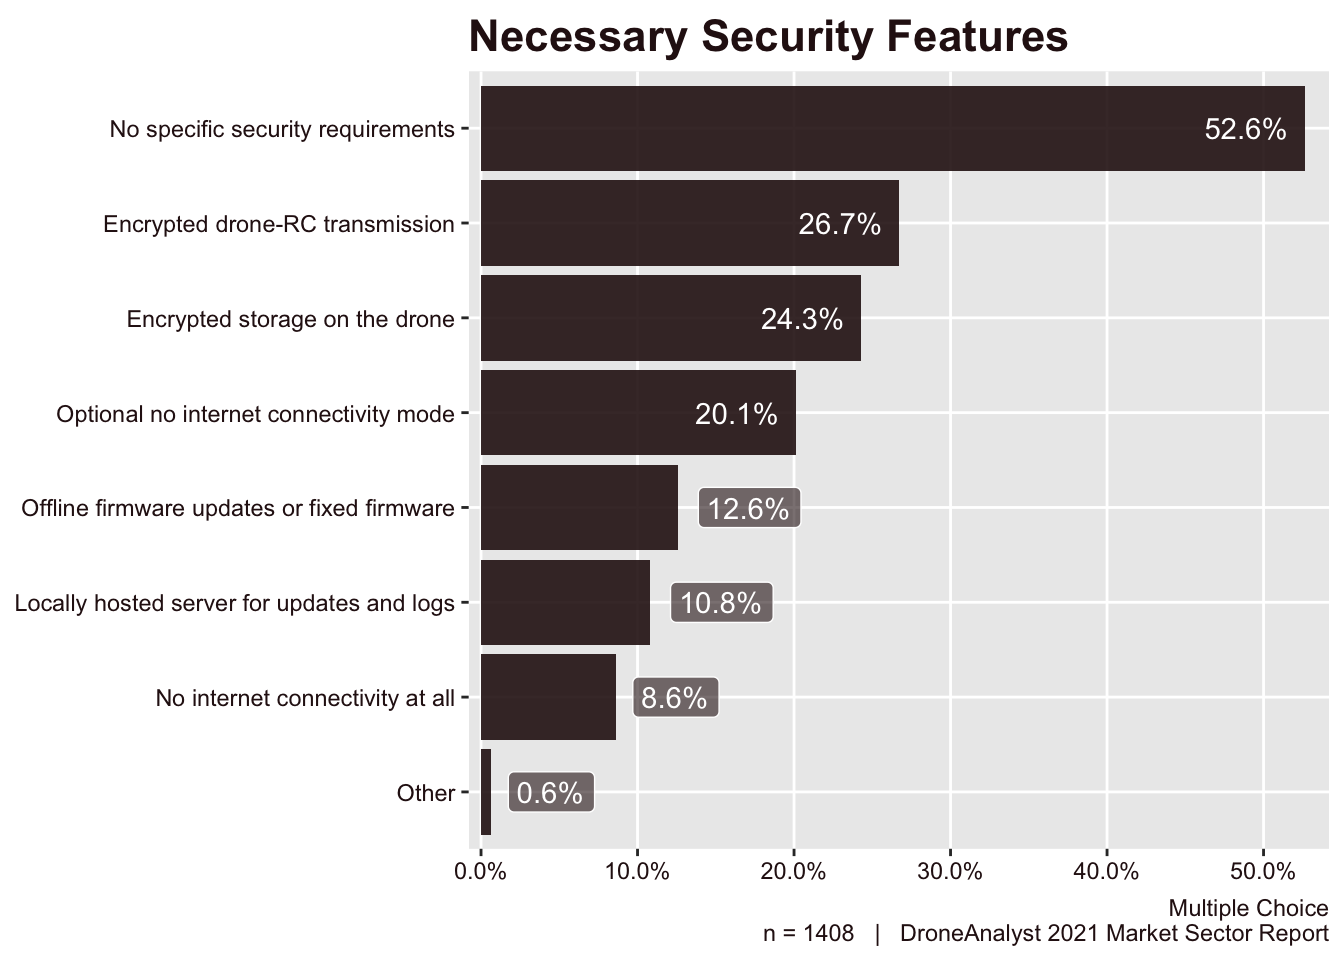
Figure 4.26: Necessary Security Features
Yet again this year, we saw that over half (53%) of all respondents said that they have no specific security requirements when purchasing a drone. This was followed by over a quarter (27%) of respondents requiring an encrypted drone to RC transmission system, which all drones we are aware of do have.
While the overall market hasn’t shifted, in general we do see more drone buyers having more sophisticated and nuanced security requirements, with all requirements growing by a few points.
The fact that few respondents selected Other and wrote in an additional requirements suggests that this problem has known solutions that manufacturers can take to address concerns.
We have also split out these results by sector in Figure ?? below. It is important to note that these results are out of 100%, although respondents could choose several responses as long as they did not have no security requirements. Therefore, the figure displays relative importance of each security feature, but not the absolutely accurate proportion of respondents that selected each feature.
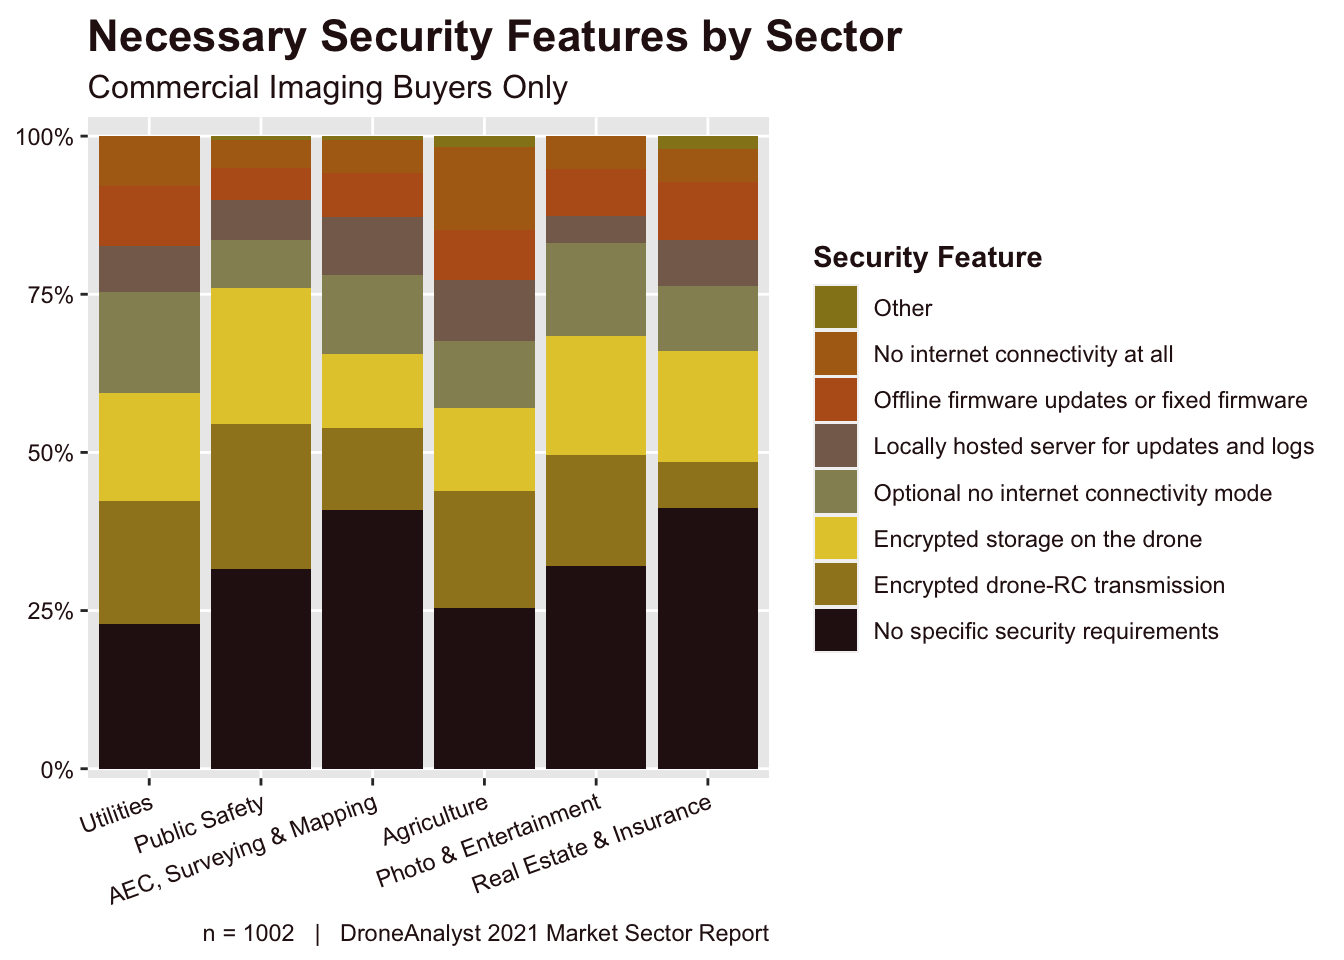
Figure 4.27: Necessary Security Features by Sector
We can see clearly that Utilities and Agriculture were the most likely to have security requirements when purchasing a drone, followed by Public Safety buyers. Public Safety buyers were also most likely to require encrypted storage on the drone, which is a key component for ensuring drone data can be used in court as evidence.
Agriculture buyers were the most likely to require no internet connection at all, which makes sense considering that internet connection is not always reliable in rural environments.
4.9 Impact of Security Concerns and New Regulations on Chinese-Made Products
Ever since the first ICE memo released in August 2017, the industry has seen a series of claims from different US government entities on the cyber security and national security concerns about Chinese-made and originated products. These concerns have spread globally to Japan and elsewhere as tensions between China and the US around transportation tech leadership, espionage and more rise. This has led DJI to be added to the US Commerce Department’s Entity List, with a targeted executive order and proposed legislation at the state and federal level that would similarly impact this space.
While there have been no outright bans of Chinese-made tech, we wanted to better understand the rhetoric and legislation’s impact on drone purchases. We asked respondents directly how these concerns have impacted their purchasing decisions in the past year. We limited responses to a few options, including two opt-out responses that they have “not seen an impact” or are “not aware of these concerns”. These opt-out responses appeared first in the survey. We visualized the responses in Figure 4.28.
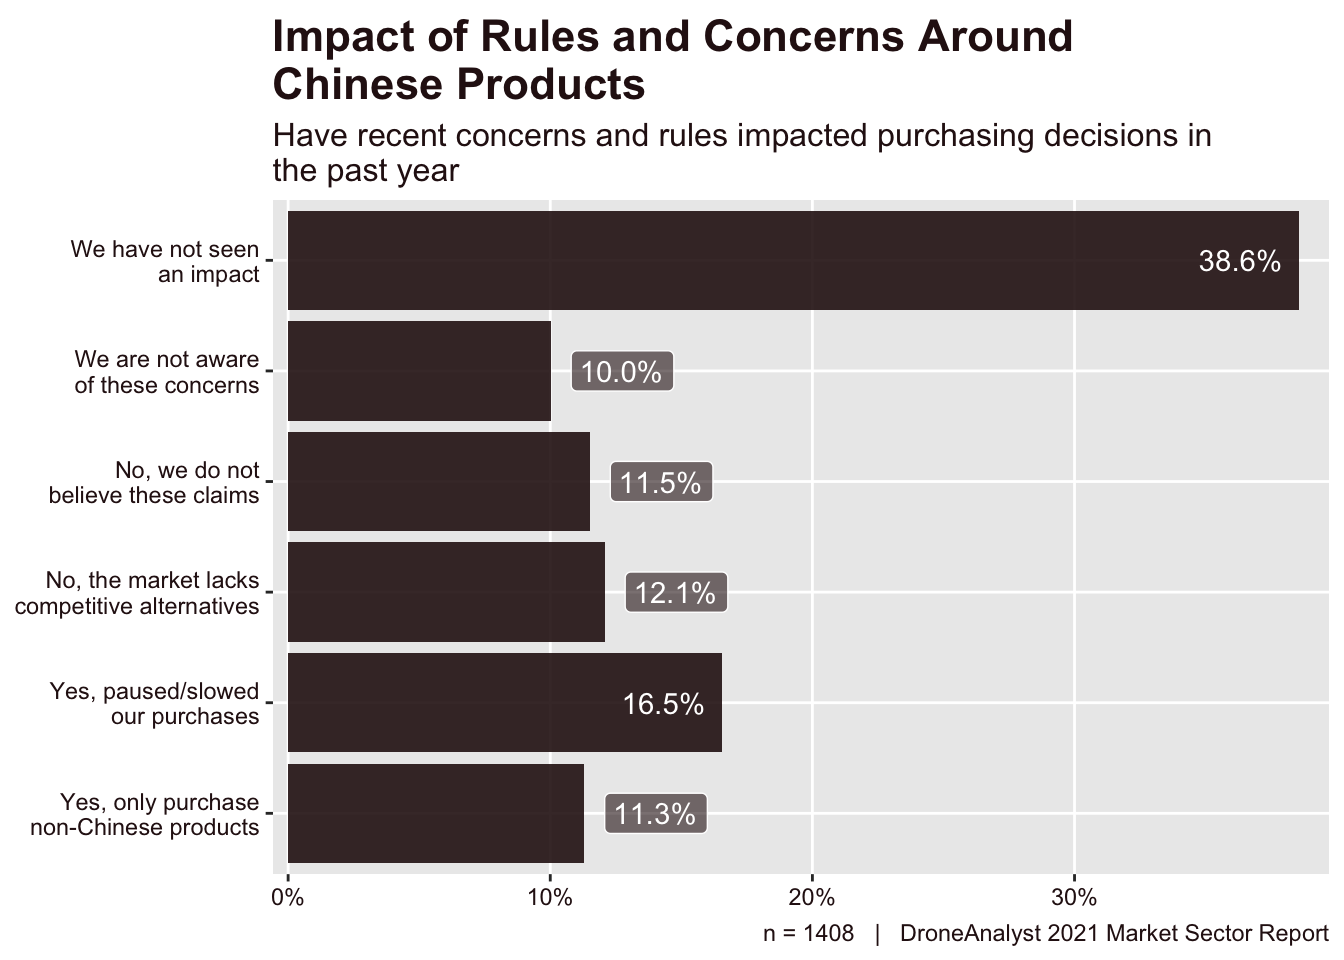
Figure 4.28: China Security Concerns
Overall, these concerns are fairly widespread, with just 10% of respondents answering that they are not aware of these concerns. Despite the broad awareness of these claims, those not impacted make up the majority of drone buyers, at 71%. This is a small, 2 point drop from last year’s 73% of respondents not impacted.
Of the remaining 29% of respondents that have experienced an impact of these concerns on their purchasing decisions, 59% had paused their purchases while the remaining 41% moved to alternative products. It’s important to note that inherently prospective buyers in the first category will be underestimated in our survey, as they must have purchased a drone within the past 12 months to answer this question.
The impact of these concerns varies broadly by the sector the buyer is in, as some industries will have more competitive alternatives, stricture procurement processes and other factors. On the topic of competitiveness, our previous research has shown that product segments where DJI faces competition make up only 20% of their sales (by units). This by sector breakdown is shown below in Figure 4.29.
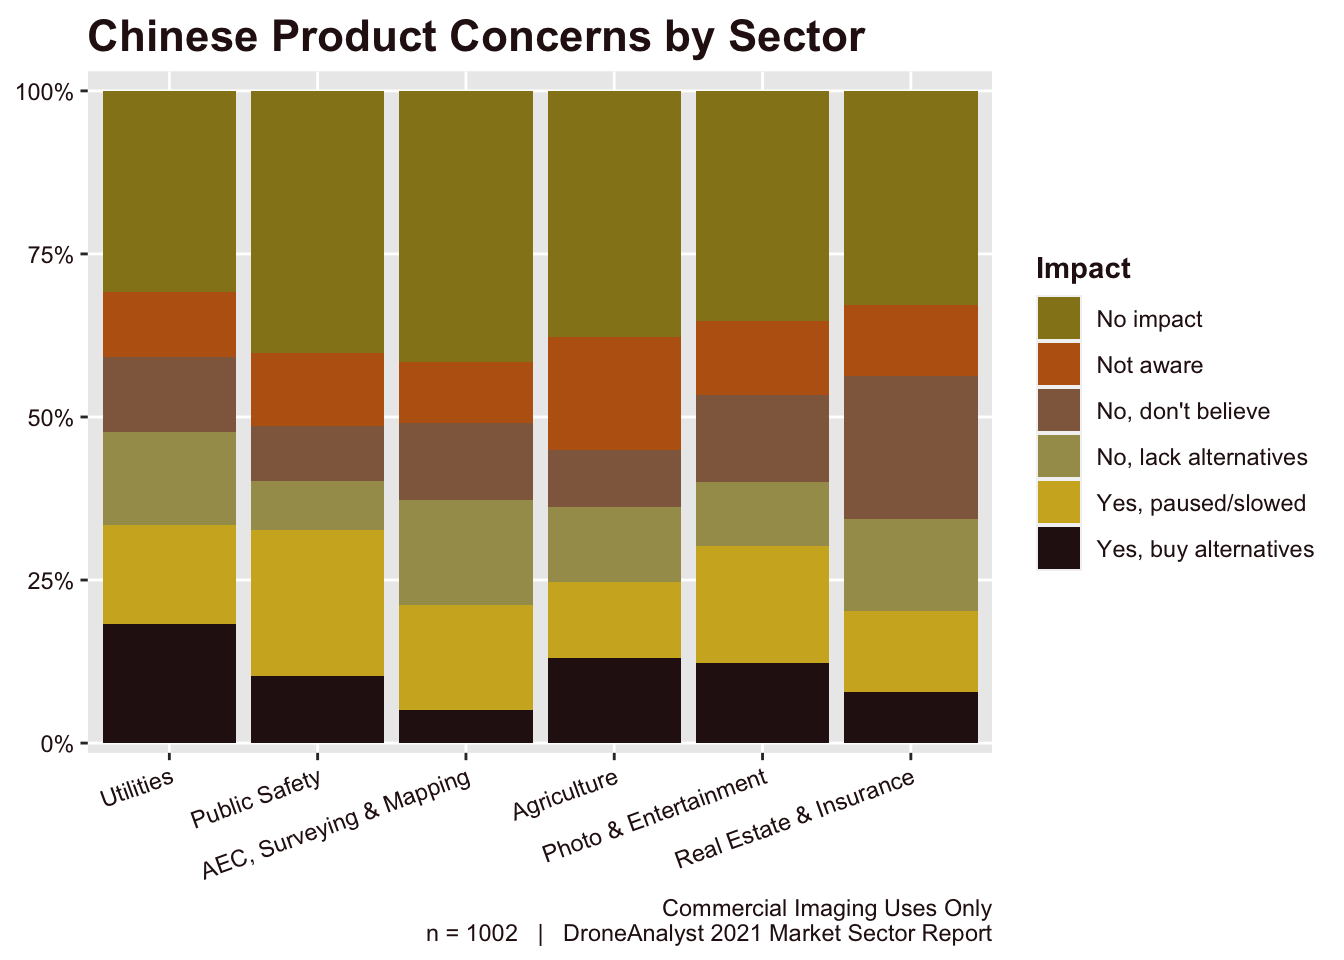
Figure 4.29: Chinese Product Concerns by Sector
There are two interesting ways to read this chart. The first is to read from the top down, looking at where the orange category (Not Aware) reaches for each sector. This shows that the Utilities and Public Safety sectors were most likely to be aware of these issues.
The second way to read this chart is to look at the first yellow category (Yes, paused/slowed purchases) which quickly tells us which sectors were most impacted. Combined together, we can see that while buyers in the Utilities sector were most likely to be aware, Public Safety buyers were impacted at nearly the same rate. Among the impacts, buyers in the Utilities sector were more likely to move to alternatives, while public safety buyers mostly paused or slowed purchases.
Buyers in the Photo & Entertainment sector were surprisingly the third most impacted sector. This sector has a large amount of drone service providers in it, and many have expressed concerns around flights near military bases or other areas which scrutinize the hardware being used.
Lastly, buyers in the AEC, Surveying & Mapping sector were most likely to select that they were not impacted as the market lacks alternative hardware. This is very true for the all-in-one RTK mapping quadcopter category (DJI’s Phantom 4 RTK being the defining product here). While the fixed wing / VTOL space here is competitive, the quadcopter space is mostly untouched, with competitors lacking the RTK module or, like Autel, having announced a product but have continually delayed the delivery of this unit.
These concerns are also highly dependent on the region the buyer lives in and does business in. As many of the underlying factors are tied to the media interpretation and storyline, there is a huge variance in awareness and perception of these concerns.
Generally speaking from our highly nonscientific conversations with drone customers and stakeholders globally, North America is the most concerned, followed by select areas in East Asia (Japan, South Korea) and South Asia (particularly India who has passed their own regulations). Europeans have a large variety of opinions, but generally are not as concerned as Americans are. Middle Easterners are very aware of the struggle, but don’t particularly care today (but will likely in the future). Those in Latin America and Africa generally see this as a geopolitical struggle between China and the US and therefore take these concerns with a grain of salt.
Now that our internal understanding is out of the way, we have displayed answers to this question across each region below in Figure 4.30. Please note that the regions are arranged from most (left) to least respondents, so take the datapoints for regions other than North America and Europe & Central Asia as for reference only.
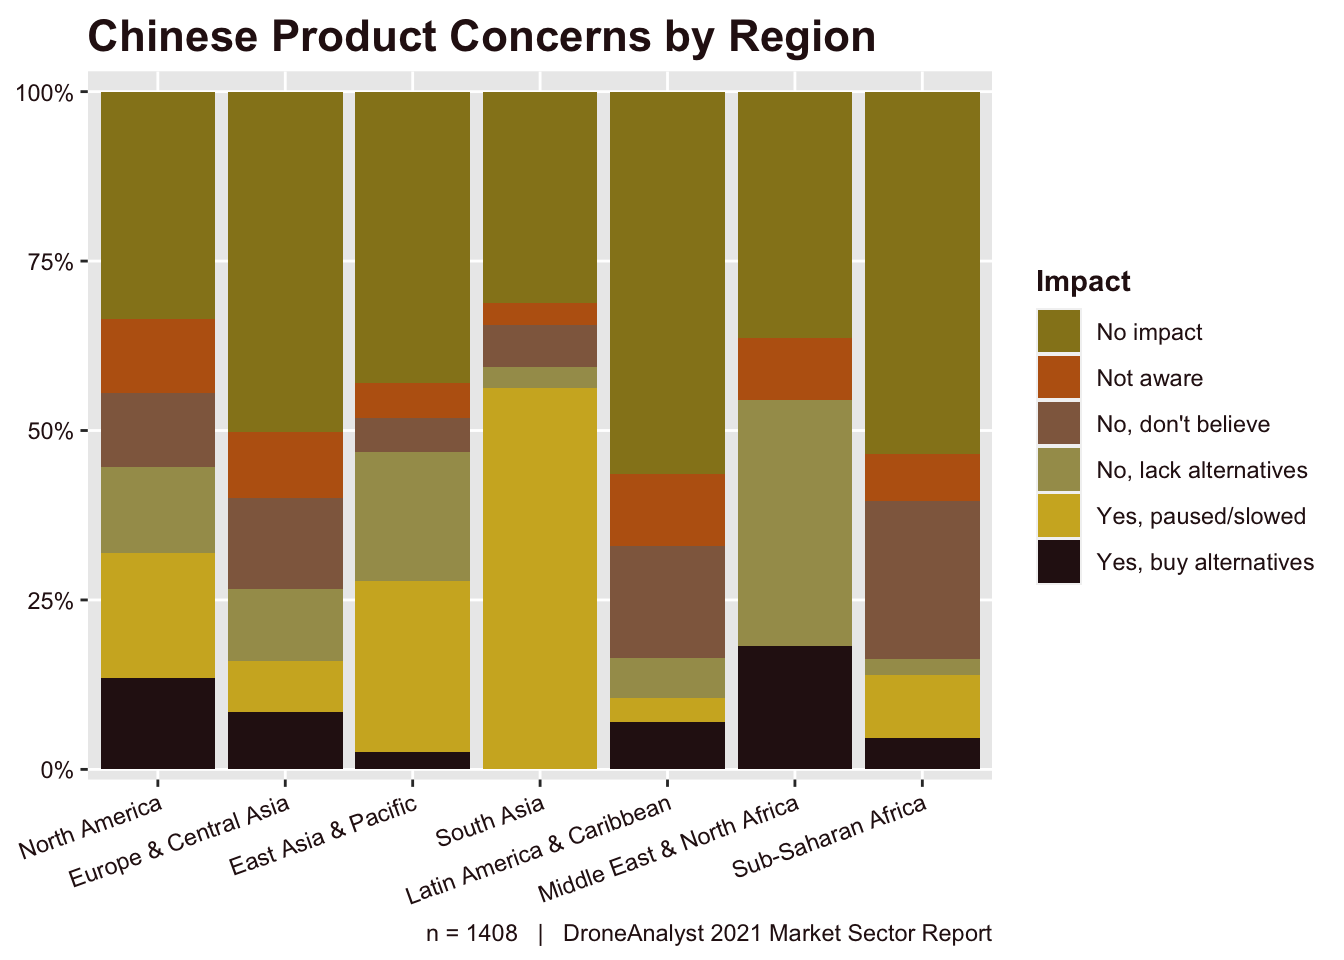
Figure 4.30: Chinese Product Concerns by Region
Generally speaking, our nonscientific conversations are fairly accurate. NA respondents were the most aware and very likely to be impacted. South Asia, where most respondents are from India, have paused purchases as new rules have come in place to limit the hardware available in the market that isn’t domestically made. Europeans were less impacted, and more likely to not believe the concerns than those in NA.