Service Providers
Introduction
We define service providers as those individuals or companies that offer drone-based imaging or sensing services for outside hire or sale. A total of 643 respondents answered the qualifying question and the questions for this section. The confidence level for this portion of the survey is 95% ± 3.86.
This year we made a small modification to the qualification process. We have noticed that increasingly many drone programs are providing drone services as a new business line to other firms in their industry. We have added an option for this category of users, and would redirect them to the business and agency user section instead of the service provider one. This helped us retain this section’s core focus on service providers where providing drone services is the core aspect of their business.
Primary Services and User Segmentation
Just as we have done with the other sections, we begin our analysis by analyzing responses to our question asking about the primary services each firm offers. This provides better context to the rest of the data in this section, and allows us to better break down our later analyses into specific sectors.
There is an important difference between our data here compared to other sections, in that many service providers will conduct business across several applications, so a narrow segmentation doesn’t always fit best. To handle this, we prompted service providers to select their three primary services offered. Service providers could select just one or two options, but nearly all selected three, with the average amount of services selected being 2.7. This does not immediately impact how the figures will look, but it is important to note about the nature of these firms when looking at the results.
Just like we had done in our drone purchases section, we have further filtered these nuanced options into broader sectors (see Figure 4.1 for the section on drone purchases by sector) to better understand variations in trends across sectors. The sectors are fairly aligned with drone purchases and business & agency users.
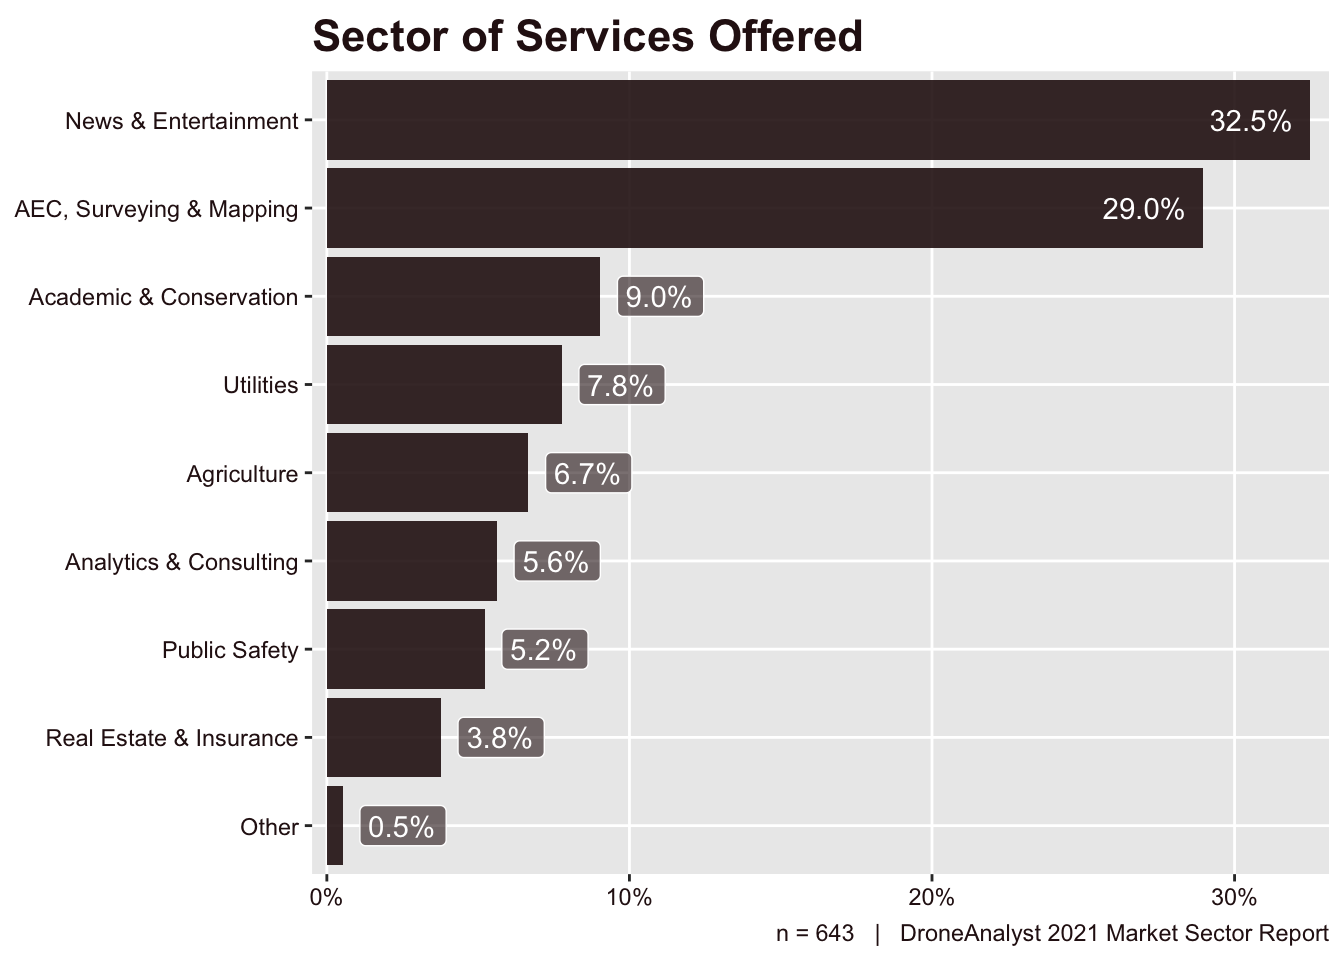
The breakdown of primary missions by sector is below in Figure 6.1.
Service providers tend to be primarily gathered among the news & entertainment and AEC, surveying and mapping sectors, which is a trend we’ve seen since 2018. It’s interesting to compare these findings with the breakdown of business and agency users by sector (Figure 5.1). While the broad strokes are similar, AEC overtakes news & entertainment, and overall there are more business and agency users operating in the public safety, utilities and other sectors.
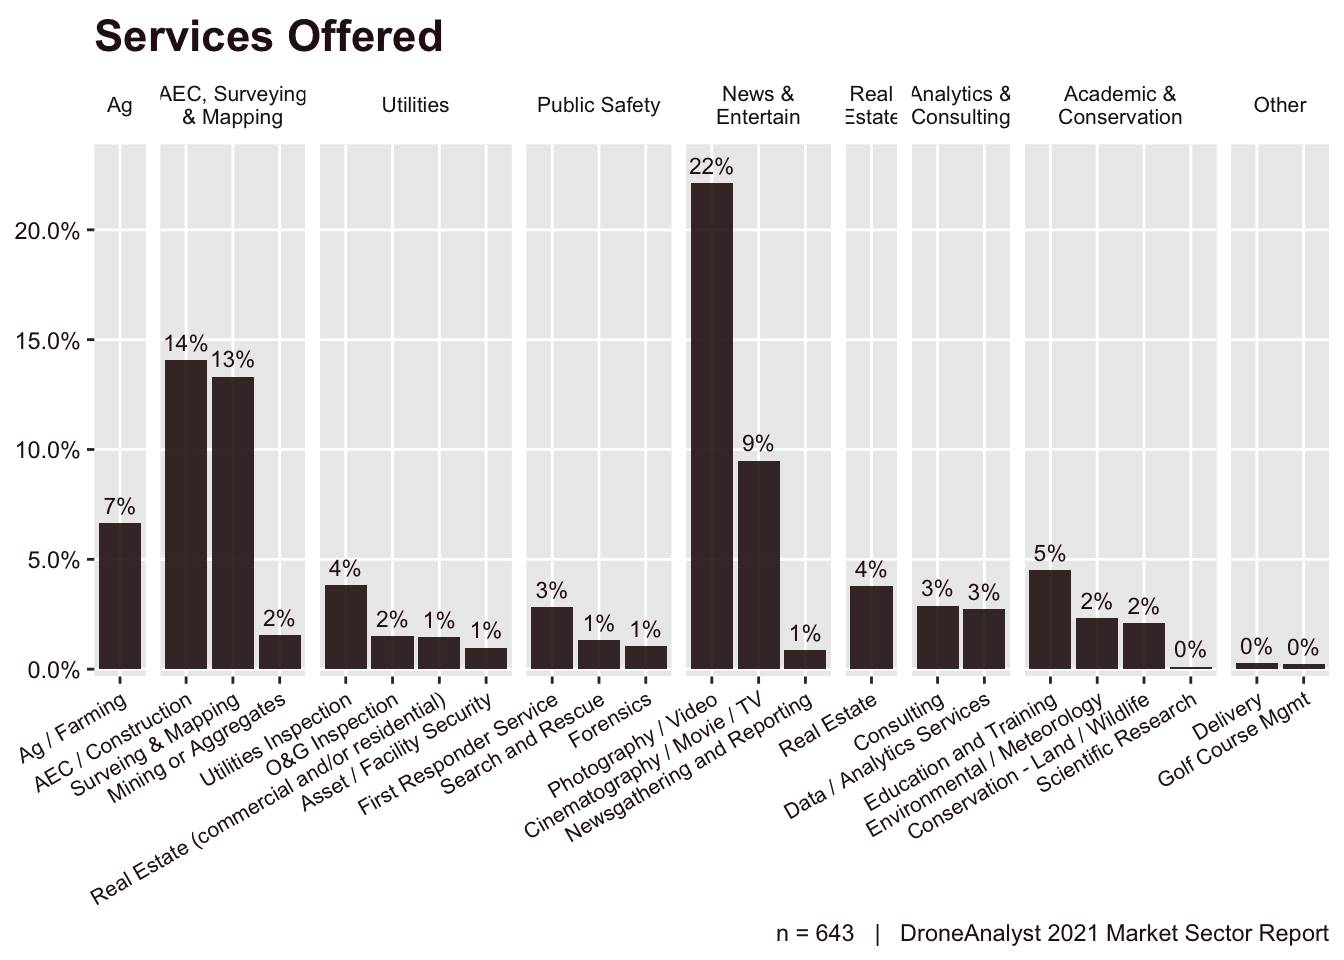
Figure 6.2 below explores the more nuanced services that fit into the broad sectors shown above.
It’s important to note here that the most selected services was also the most broad and general, Photography / Video, that while we added this to the News & Entertainment category, it does not mean these service providers are providing this service only. Due to this question being multiple choice, this large concentration does not really impact the results.
Maturity and Length of Services Businesses
We begin our deeper analysis by exploring datapoints around the maturity of services businesses, starting with how long these businesses have been operational.
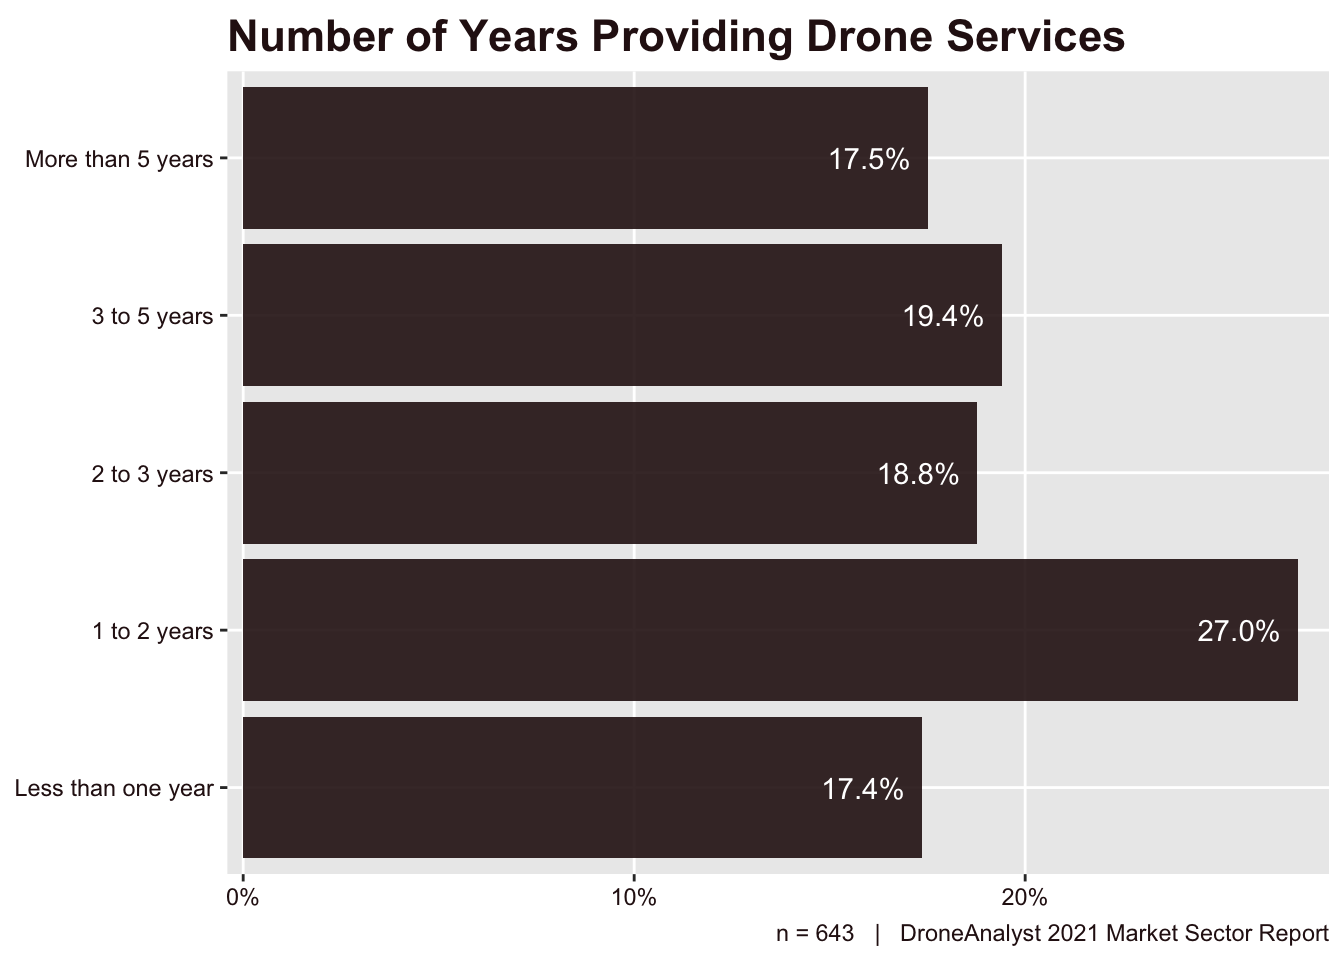
Figure 6.3 below breaks down how long these service providers have been operational. It’s always important to keep in mind that the FAA put Part 107 rules in place in the middle of 2016, or 5 years from when we collected this data.
We saw a large uptick in services providers 1 to 2 years ago. A few people we talked to suggest this may be a COVID bump, as new entrants looked for a side business for income during the pandemic. This may be particularly true for commercial airline pilots, who were all laid off around the same time and would have significant transferable skills in a move to becoming a drone pilot.
Otherwise, we broadly see a trend towards more maturity in the market as service providers tend to have been in the market longer than before. This is ofcourse a very logical conclusion, mostly signifying that we aren’t seeing massive entrants into the market. To put things in perspective, service providers that had entered the market within the past year made up 60% of respondents in 2017, 50% in 2018 and 30% in 2020.
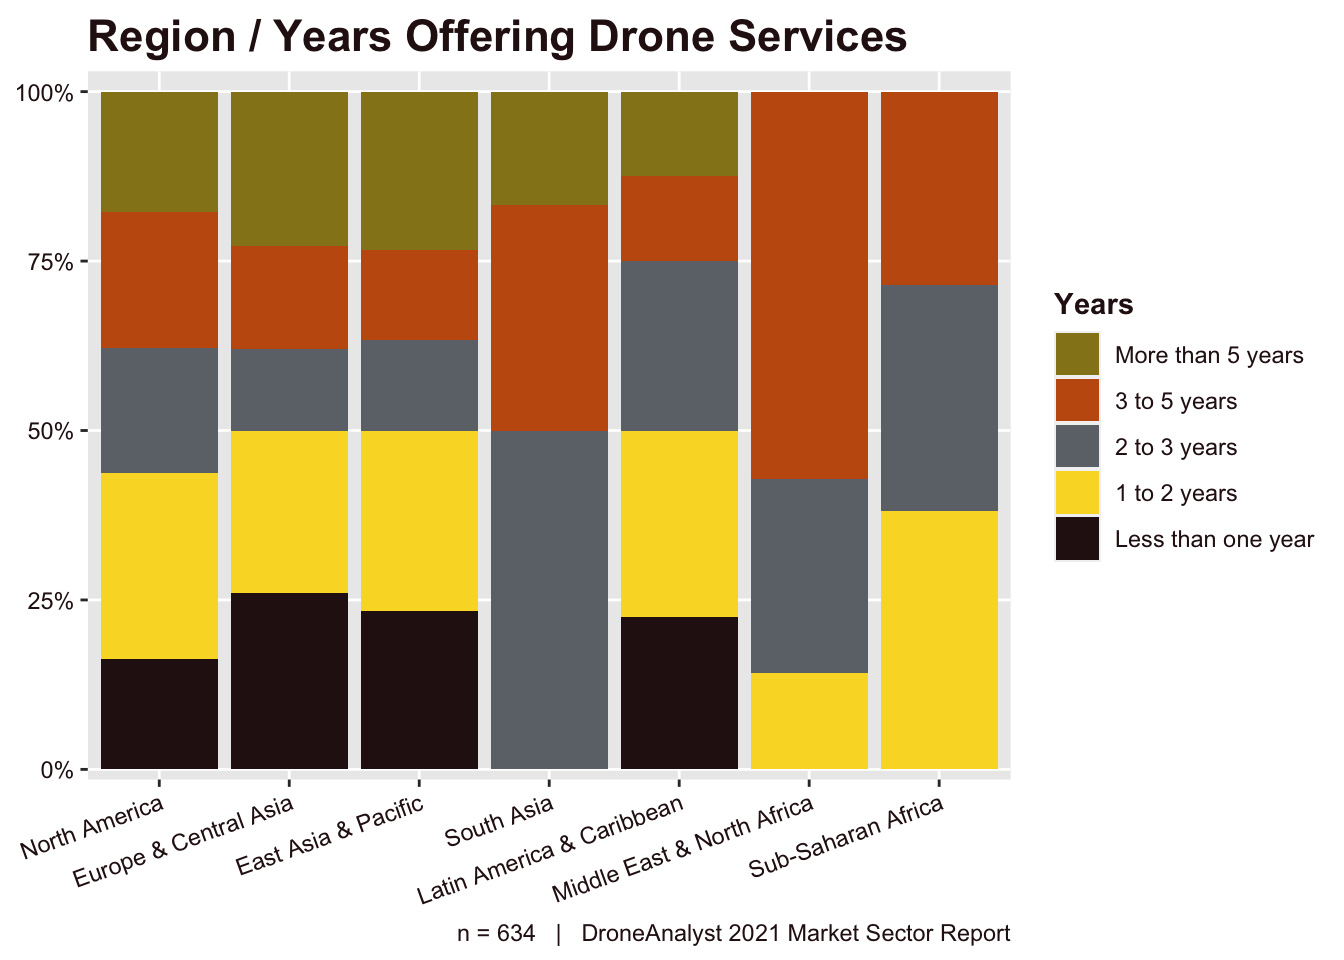
As regulations move at different speeds around the world, we have split this data out by region below in Figure 6.4.
From this chart, we can say broadly that most regions have a similar general makeup, but there are variations and outliers. Some outliers I would like to call out are the large grouping new entrants in Europe. This matches the movements by EASA in introducing new guidelines for commercial drone operations that harmonized rules across the European Union.
Revenues and Scale
Each year, we assess how large these service businesses are. Data on their size and revenues are critical to understand how healthy the drone market is.
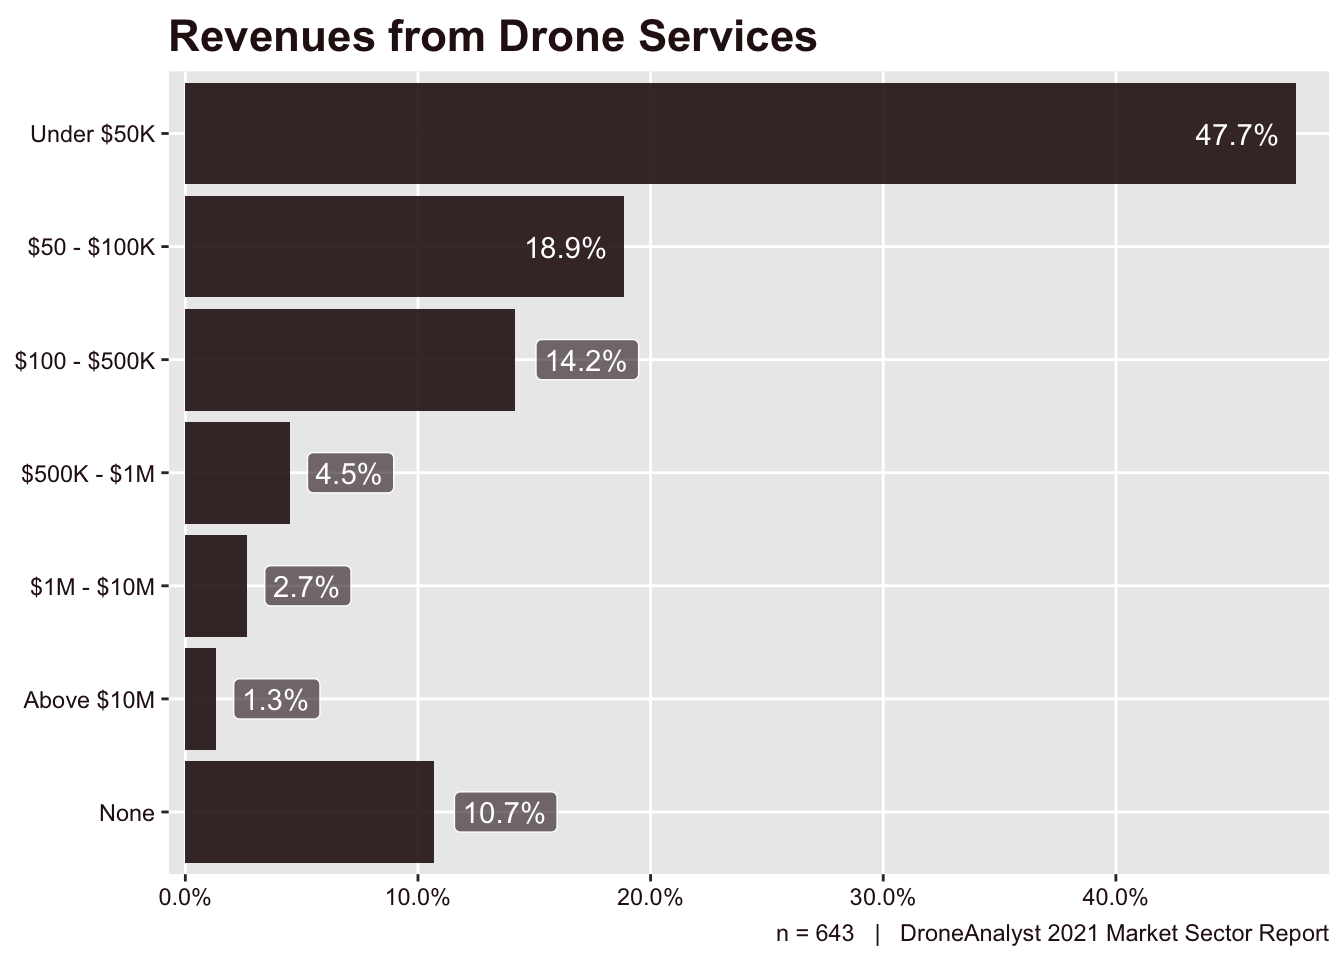
First we explore service provider revenues below in Figure 6.5.
The data shows that 11% of service providers reported making no revenue at all, and close to half (42%) make more than $50,000 per year. While in previous years we have not seen much movement in these revenue numbers, 2021 seems to have turned that around. We suspect this positive trend is not just more spending and revenues across the market, but also due to the fact that a few early entrants to the market had left and prices rose to reflect this shift.
Table 6.1 below explores how service provider revenues have shifted over the years. The data below is slightly different from the chart above as we removed respondents who selected that they made no revenue. This is true for all years, and it is also important to note that the portion who selected none has decreased significantly over the years.
Table 6.1: Changes in Reported Revenues Over Time
|
Revenues
|
2017
|
2018
|
2020
|
2021
|
|
Under $50K
|
67.0%
|
72.0%
|
73.0%
|
53.5%
|
|
$50 - $100K
|
23.0%
|
21.0%
|
8.0%
|
21.1%
|
|
Above $100K
|
10.0%
|
7.0%
|
19.0%
|
25.4%
|
|
DroneAnalyst 2021 Market Sector Report
|
The key trend here is that service providers that make under $50K make up almost less than 50% of all service providers.
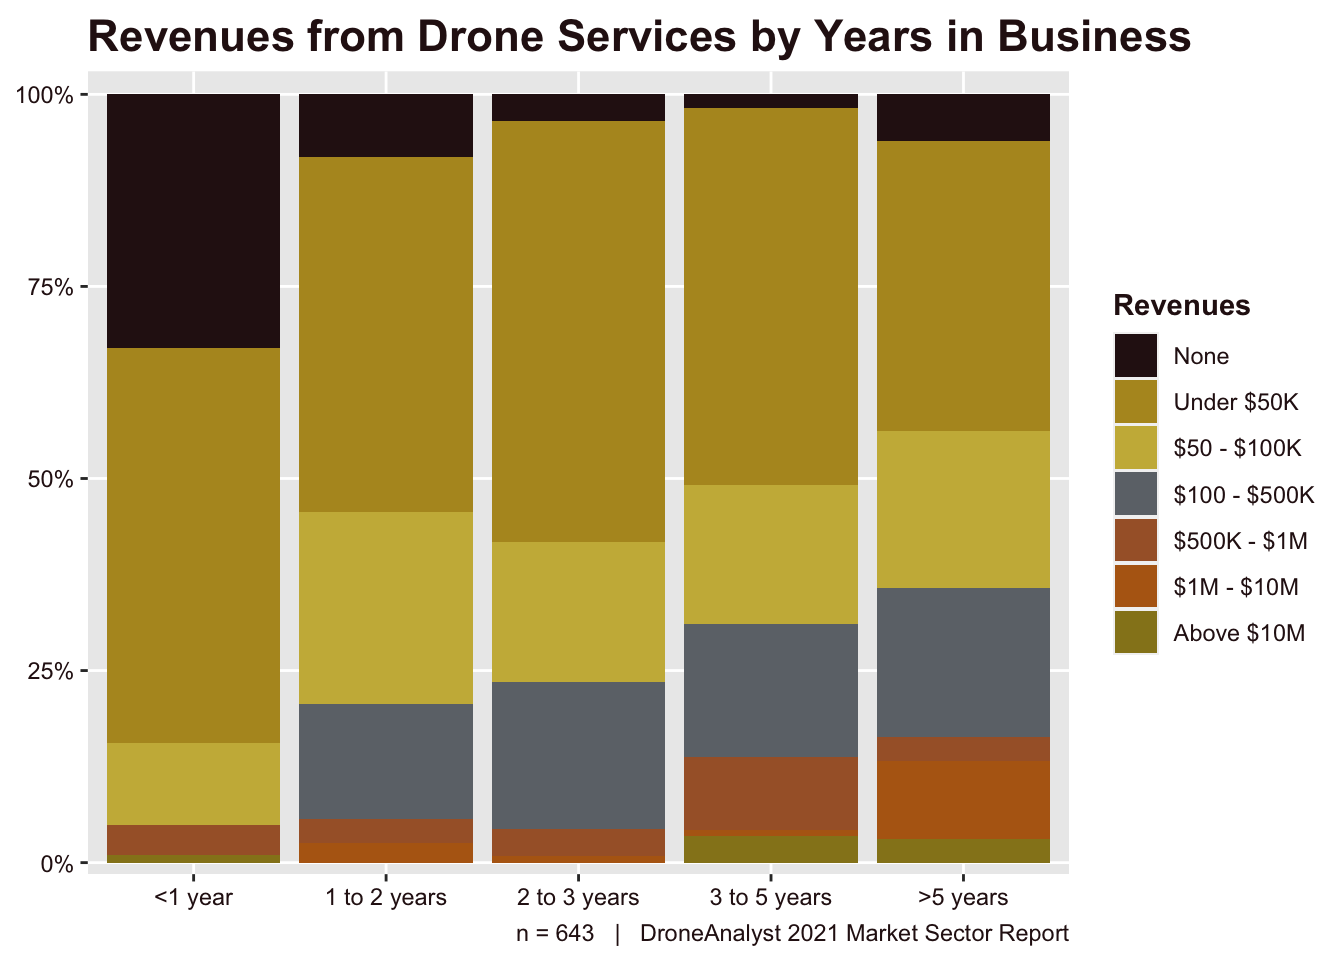
When interpreting these datapoints, it is important to remember that 17% of service providers started just this year, and a combined 44% had just started in the past two years. To better understand how these new entrants impacted the overall data, and how revenues may increase as a service provider gains experience in the market, we have split this data out by how long each service provider has been in business in Figure 6.6 below.
Through this view you can clearly see the relationship between how long a service provider has been in business and their revenues. Generally, we do see a strong climb in revenues, with much of the growth being in the above $100K categories.
We also collected data related to how many unique drones were deployed by these firms. This data is broken out by how much revenue these service providers made below.
Table 6.2: Fleet Size and Revenues of Service Providers
|
Revenue
|
Median
|
Mean
|
|
Under 50K
|
2.0
|
4
|
|
50 - 100K
|
3.0
|
13
|
|
100 - 500K
|
5.0
|
9
|
|
500K - 1M
|
6.0
|
21
|
|
1M - 10M
|
8.5
|
12
|
|
Above 10M
|
22.5
|
34
|
|
DroneAnalyst 2021 Market Sector Report
|
There is not too much for us to assess here, but it is good to put this in perspective by recalling that our average drone price was nearly $9,000, so that is a significant portion of a small service providers annual revenues. The FAA has also provided a similar datapoint in the past, which we have summarized in our own report, concluding that in 2019 the rate of registered drones to pilots was 2.3. This is fairly aligned with our data above.
We can also use this data to broadly see that drones are also scaling with the size of the firm. If we use this 2.3 figure, we can make some broad assumptions about how many employees these firms consist of.
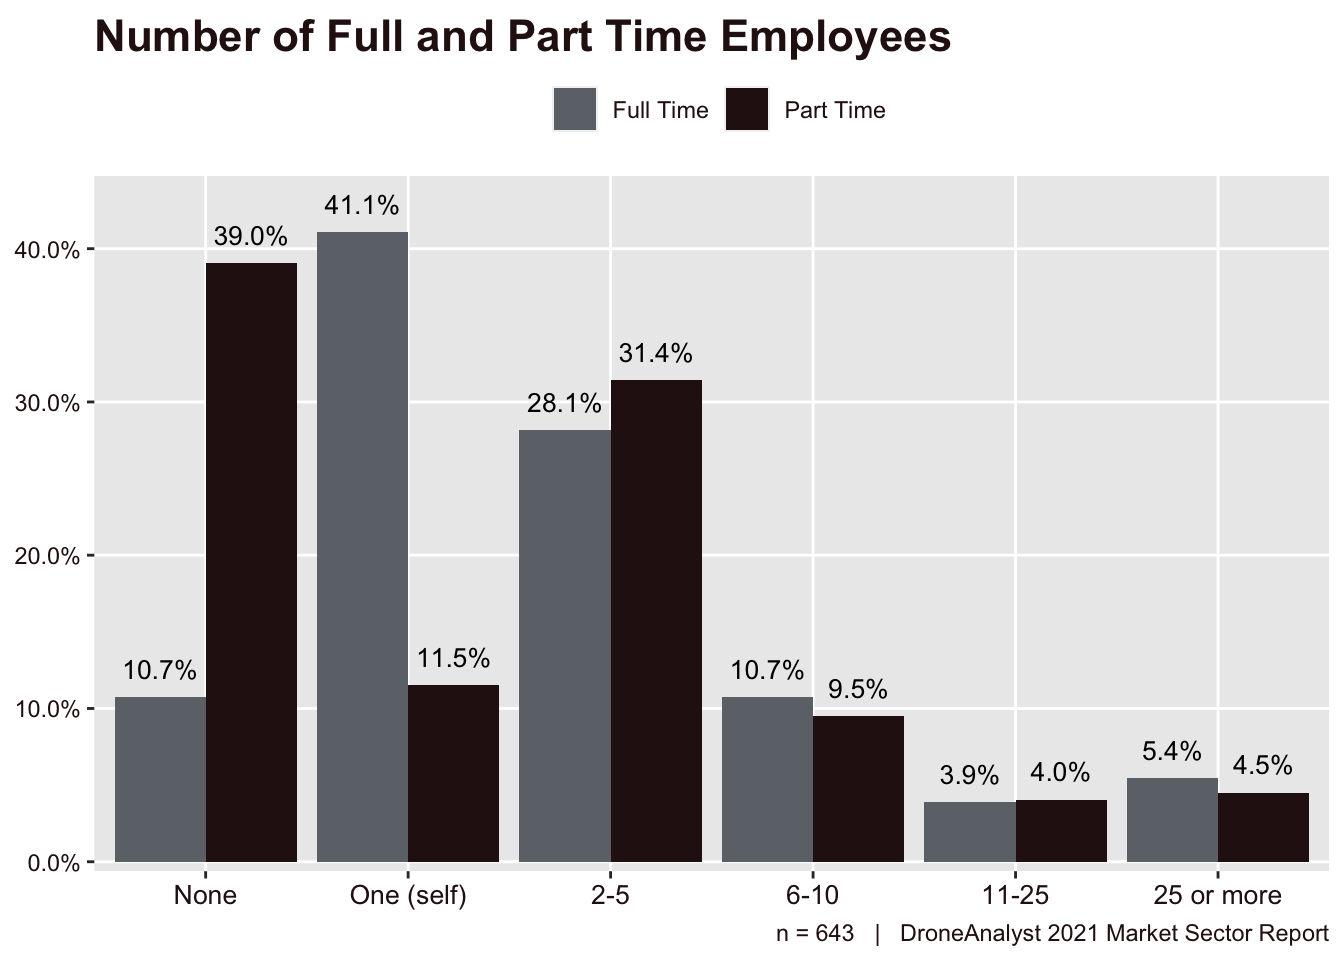
However, we did directly ask about how many employees make up each of these services firms. We asked first about the amount of full time employees that are part of the firm, followed by how many part time or contractors contributed to the firm. These results are displayed in Figure 6.7.
The first most notable thing is that answers to None and one (self) nearly matched eachother, with those selecting one (self) in full time, selecting none for part time (and vice versa). these are the true sole proprietorship drone service providers, and they roughly make up 50% of service providers.
The second largest group of service providers have 2-5 employees. We saw the largest movement this year in the 6-10 category, which made up just 4% of responses last year and is now around 10%.
Pilot Networks & Training
Over the past few years we have seen drone pilot networks gain sufficient attention and interest as they offer quick scalability to business customers and flexible, supplemental income to pilots. We wanted to better understand just how common these pilot networks are, and which ones are leading the industry.
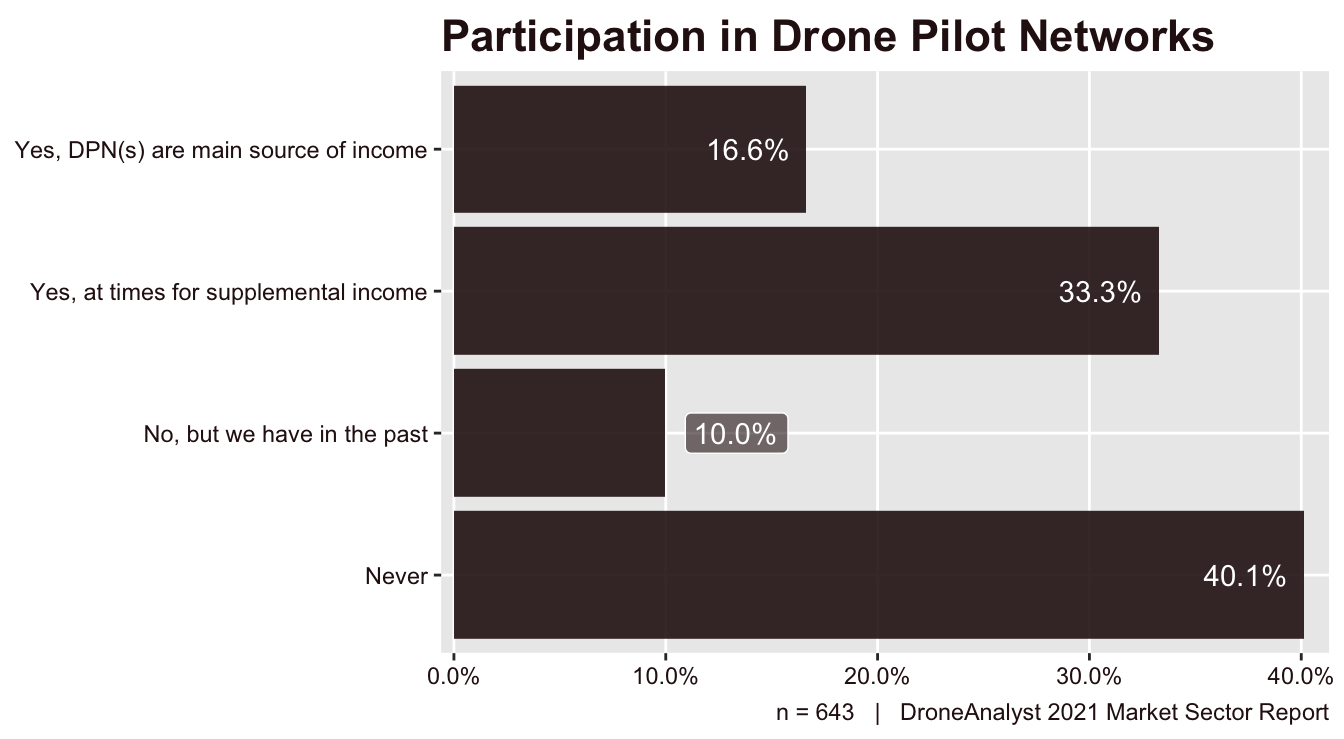
To capture this information, we first asked service providers if they have participated in a drone pilot network, and if so, how does it contribute to their broader business.
Oddly, we have a nearly 50:50 split between service providers who don’t participate in a DPN and those who do. Among those who don’t, the vast majority (80%) have never used a DPN. Among those who are participating in a DPN, just one-third rely on them as their primary source of income.
We saw a large jump in participation from last year, up to 50% overall from 30% in 2020. Despite this large uptick in participation, the breakdown of responses between main source of income and supplemental income is nearly identical.
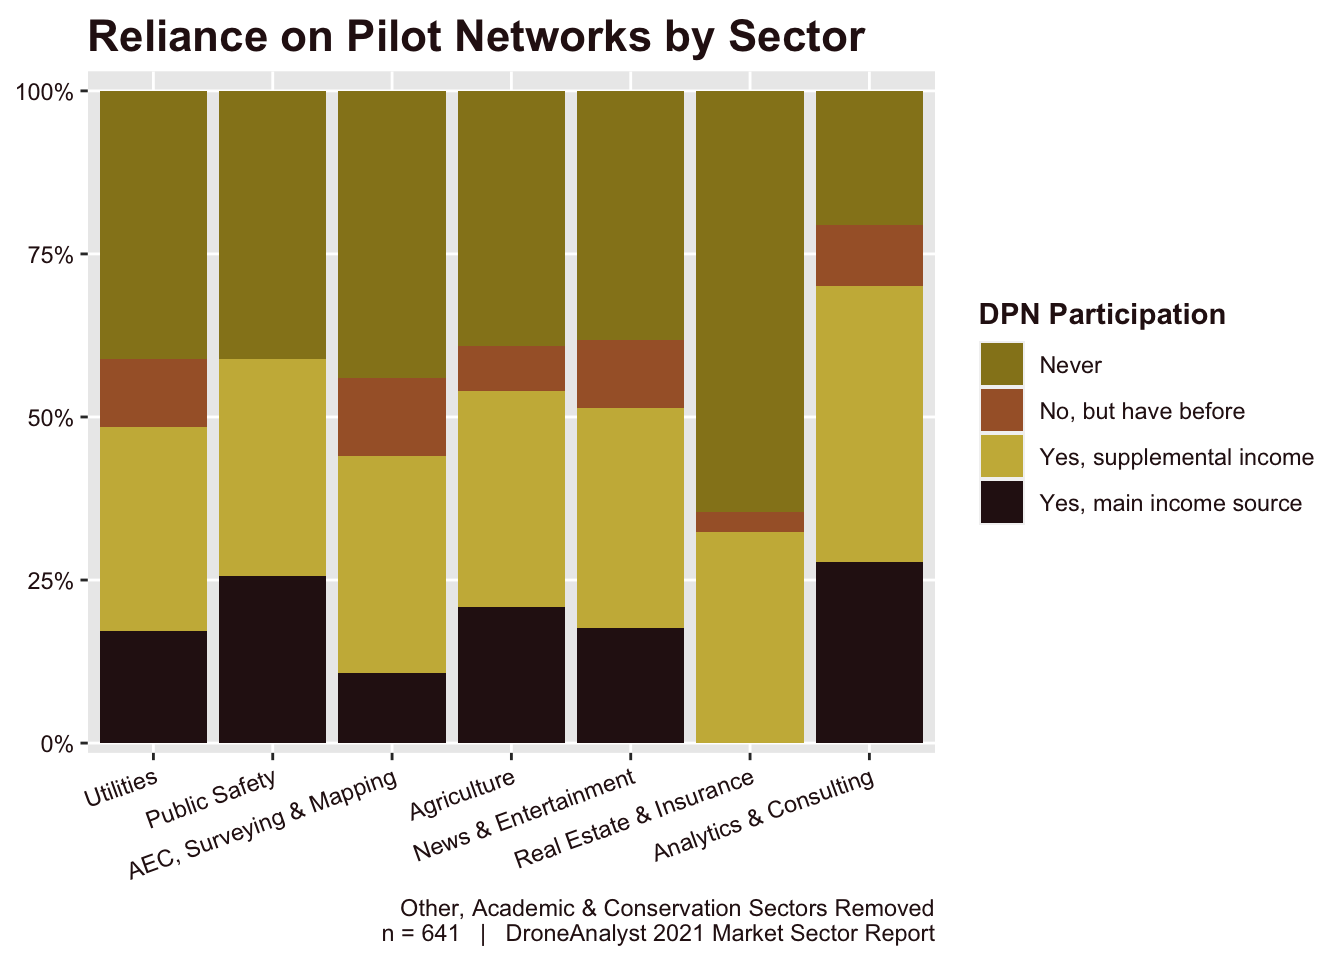
As firms across industries have various deployment worfklows and budgets for outsourced services, we wanted to understand how participation in a DPN varies by the services offered by a firm. We have broken this data out by sector and provided it below in Figure 6.9.
We don’t see too much variation across sectors, except for a lower rate among real estate and analytics sectors. This assesses the use of DPNs from the supply side, we also take a look at the demand side through how business and agency users source pilots in Figure 5.12.
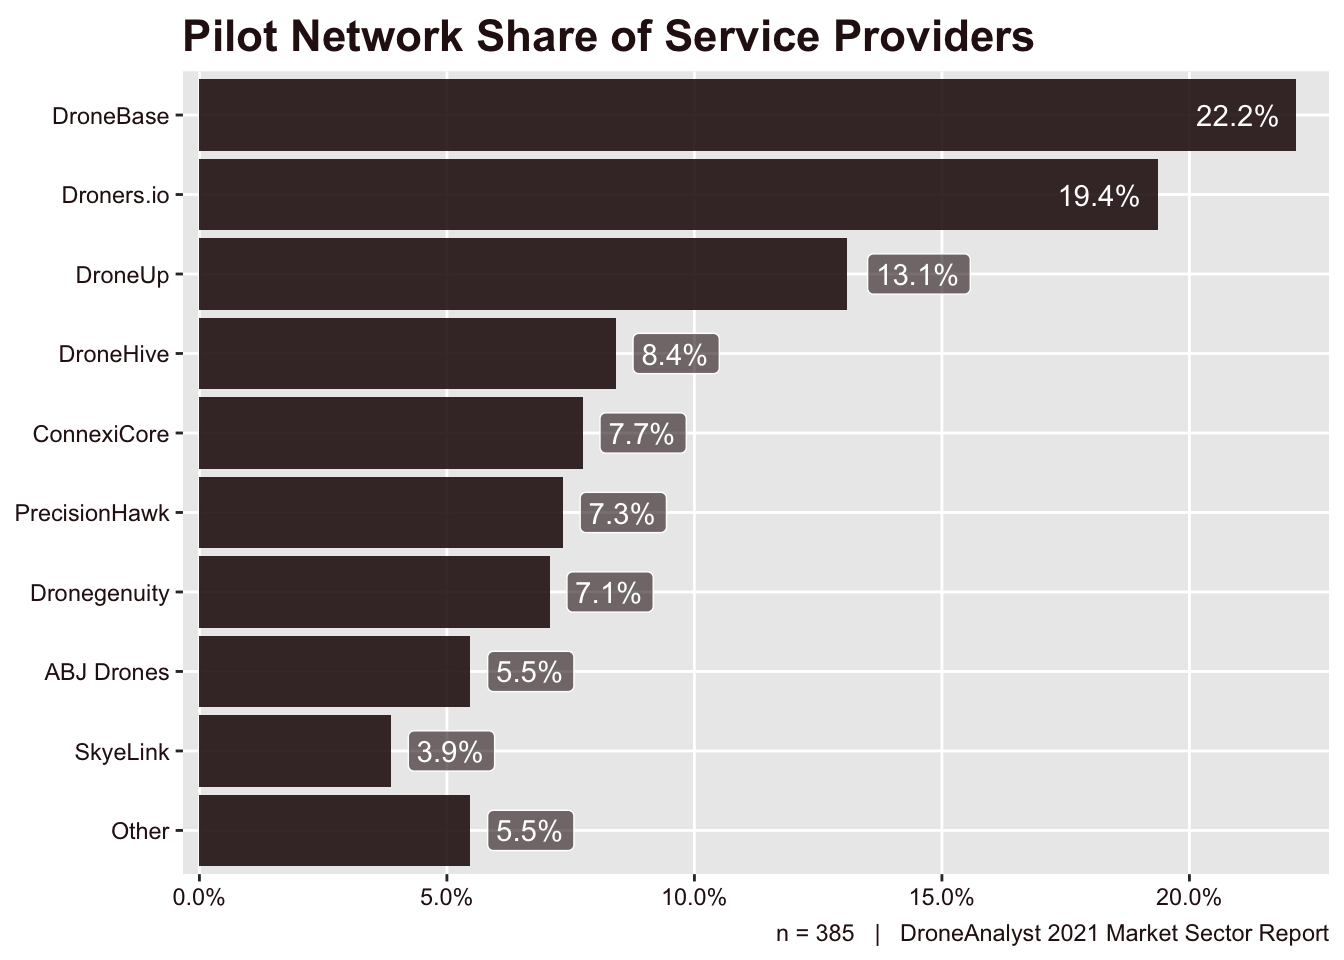
For service providers that have participated in a DPN, we asked a follow-up question about which pilot network they participated in. This question allowed service providers to select multiple DPNs or write-in an other option.
DroneBase yet again leads the market, with a 22% market share. Despite their continued lead, Droners.io and DroneUp have both made progress in closing the gap. PrecisionHawk and ConnexiCore both had interesting movement. PrecisionHawk dropped from 4th most used DPN to 6th. ConnexiCore had the largest positional movement, moving from the 9th most used DPN up to the 5th.
Challenges and Growth Prospects
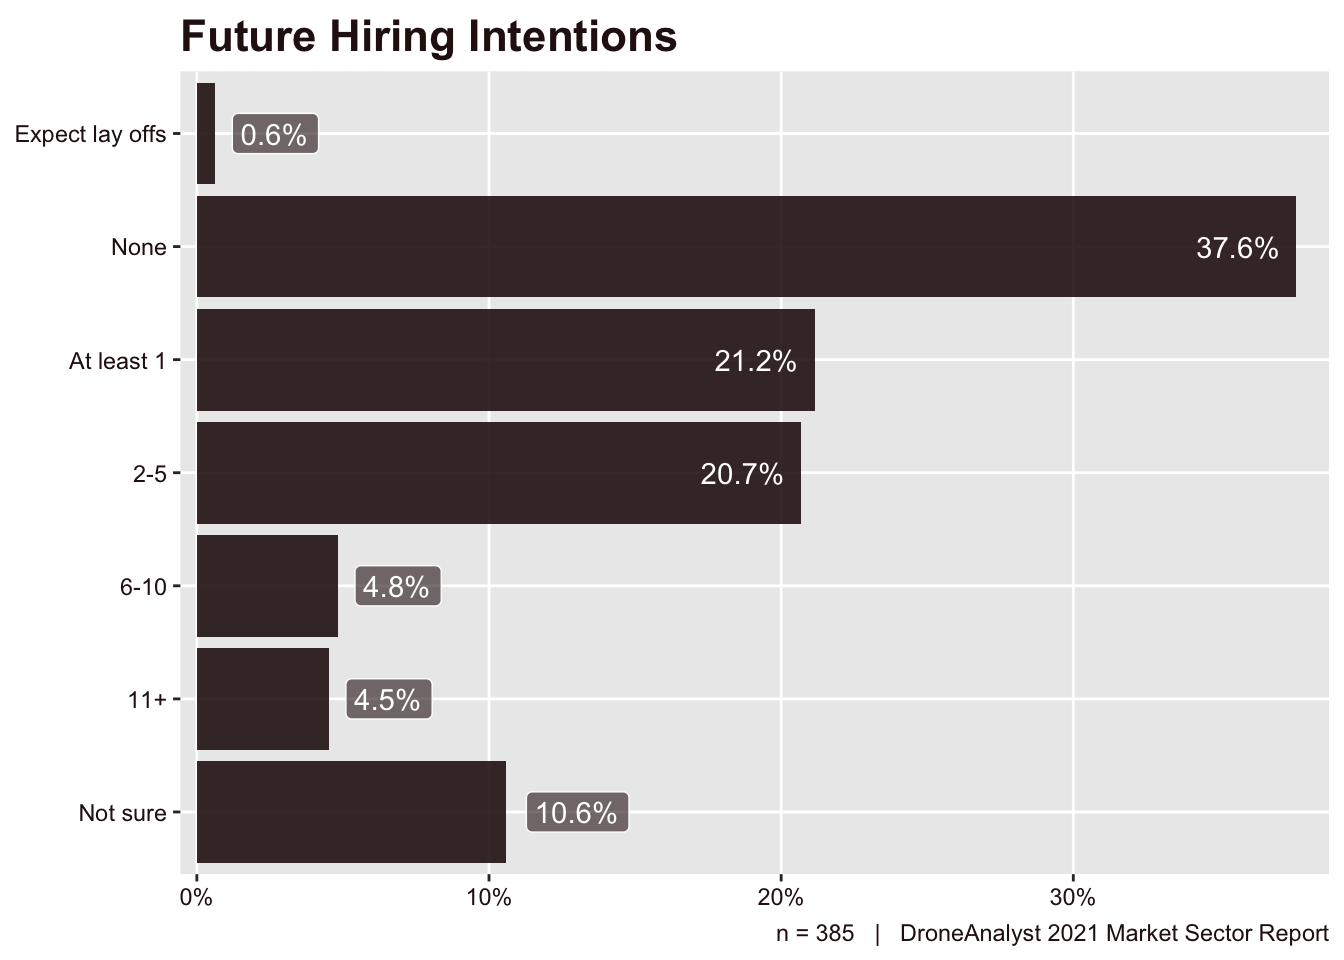
We asked two questions to gauge the growth prospects of the drone services segment. In the first question, we asked about their hiring intentions for the next year. The results appear in Figure 6.11.
The good news is only 0.6% of survey respondents expect to lay off any full-time employees, and more than half (52%) expect to hire one or more employees. This is a large uptick from last year, where just 38% expected to hire more employees. This 52% closely matches the fact that roughly 50% of service providers are not sole proprietorships, and is also where we expect to see the majority of this growth.
We saw the largest growth this year among service providers that expect to hire 2-5 additional employees, up 10 points from 2020. That is certainly a positive trend and we suspect this signifies the growth among industry-specific, localized service providers.
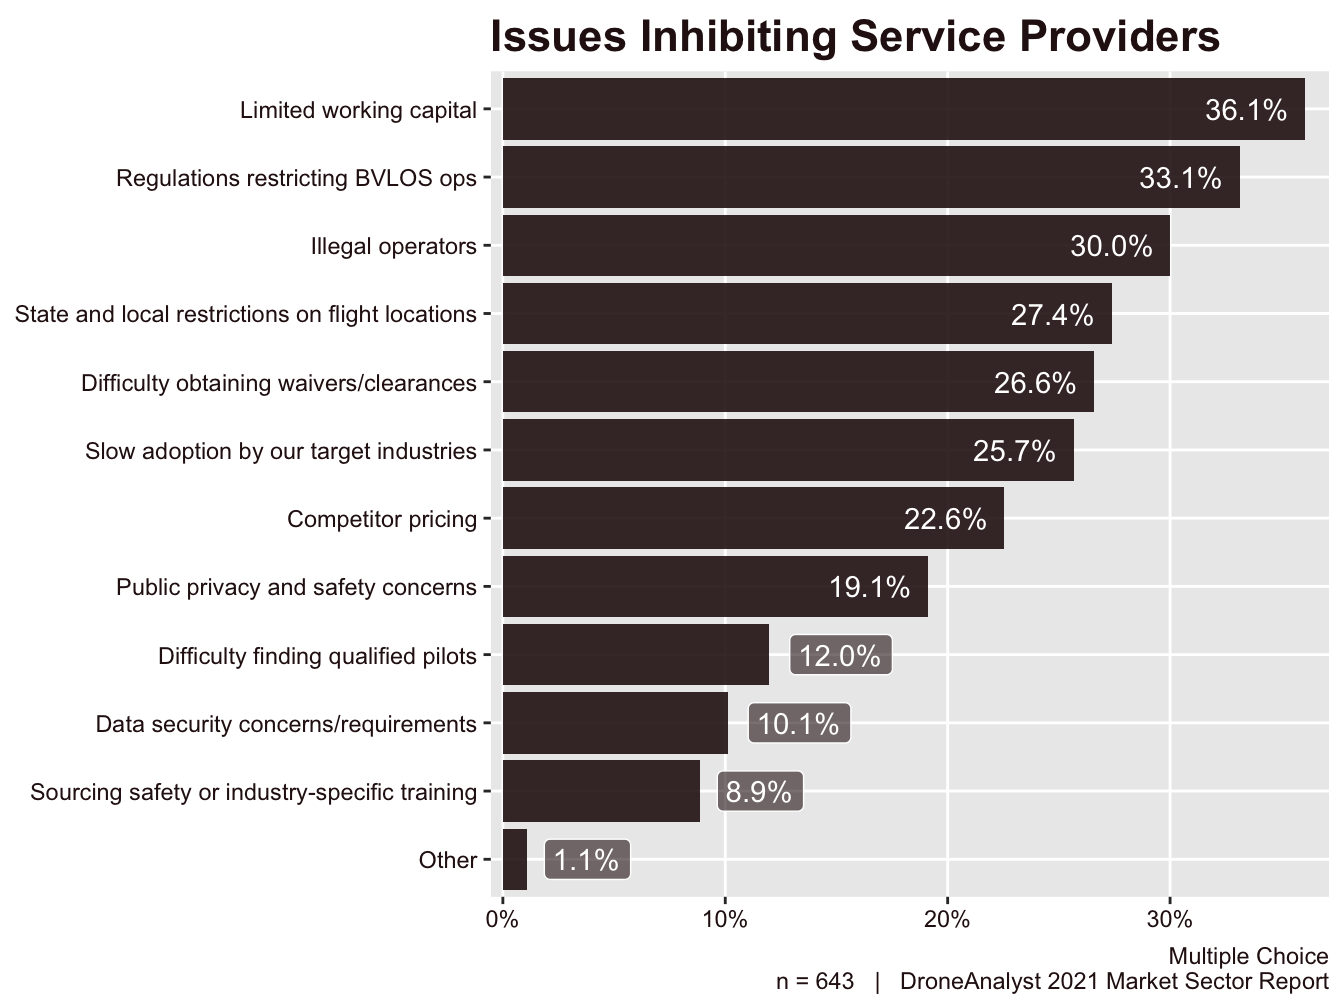
Again this year, some of the most interesting responses we received to any question in the survey were to our question around inhibiting factors for service providers. We asked what issues service providers feel are inhibiting further business growth. Respondents were presented with 11 choices and could pick as many as they thought applied. They were also given the opportunity to write in their own issues. The results for the options the survey provided appear in Figure 6.12 below.
Historically, we have seen issues related to regulations dominate the top 3 issues inhibiting service providers. This year is different, with limited working capital shooting to the top, and issues related to regulations dominating the next four most common issues. Overall, this still shows that regulatory bodies need to take steps to get the industry moving faster, but these firms have other constraints to work through themselves.
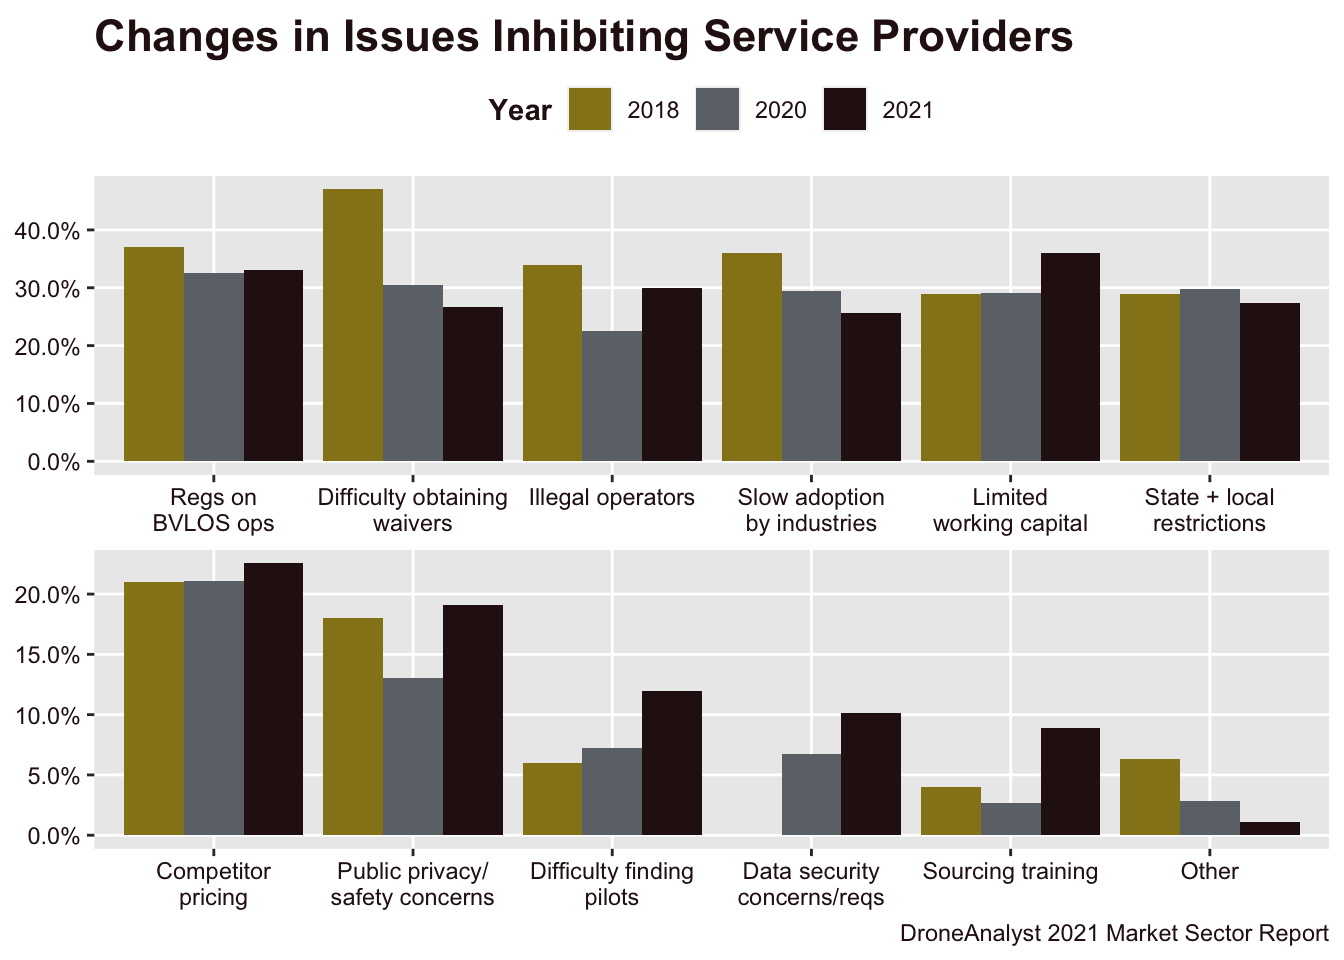
To better understand how these issues have changed over the years, we have split out the data since we began asking this question in 2018. It’s important to note that we added data security concerns / requirements in 2020. These findings are displayed below in Figure 6.13.
When viewed through this historical perspective, we can better see that business-related issues (working capital, competitor pricing, finding pilots) have risen while regulation-related issues have dropped off, albeit only slightly.
We have also started to use the amount of issues that service providers selected on average as a sign of movement in the industry. In 2018, service providers selected 2.7 issues on average, dropping to 2.3 in 2020 and has risen to 2.5 in 2021.
Putting this shift in challenges alongside movement in revenues and hiring expectations, we can see that the service provider market is experiencing high growth, with the need for more, trained pilots.