Business and Agency Users
Introduction
We define business and public agency users as those individuals, companies, or governmental departments that perform or contract out for drone-based imaging or sensing services. A total of 1,096 respondents answered the qualifying question that they either do such work themselves or contract out for it. The confidence level for this portion of the survey is 95% ± 2.96.
List of Tables
- 5.1: Top 5 Drone Services Outsourced by Business and Agency Users
Primary Missions and User Segmentation
We begin our analysis by first analyzing responses to our question asking about the primary mission of their drone program/operations. This provides better context to the rest of the data in this section, and allows us to better break down our later analyses into specific sectors.
Our question on primary mission of their drone program was a single choice question, where the respondent could either type to find an option, or select from a menu of options. Just like we had drone in our drone purchases section, we have further filtered these nuanced options into broader sectors (see Figure 4.1 for the section on drone purchases by sector) to better understand variations in trends across sectors. The sectors are fairly aligned with drone purchases, with a small addition of the analytics & consulting category.
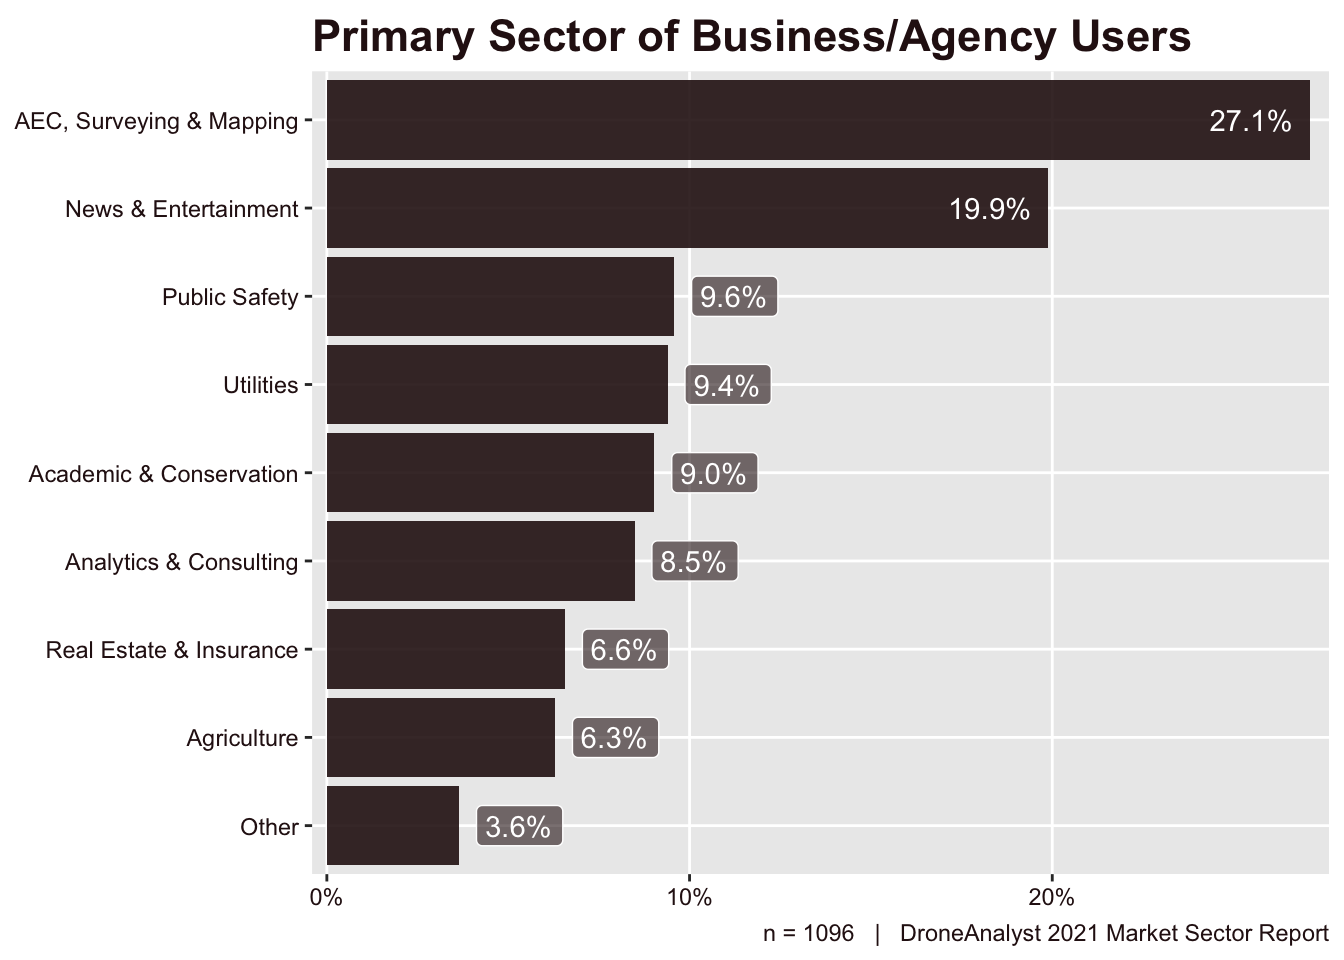
The breakdown of primary missions by sector is below in Figure 5.1.
AEC, surveying and mapping is our most common sector, followed closely by news & entertainment. These two categories made up less than 50% of responses, with the remaining sectors playing a fairly diverse role in the survey.
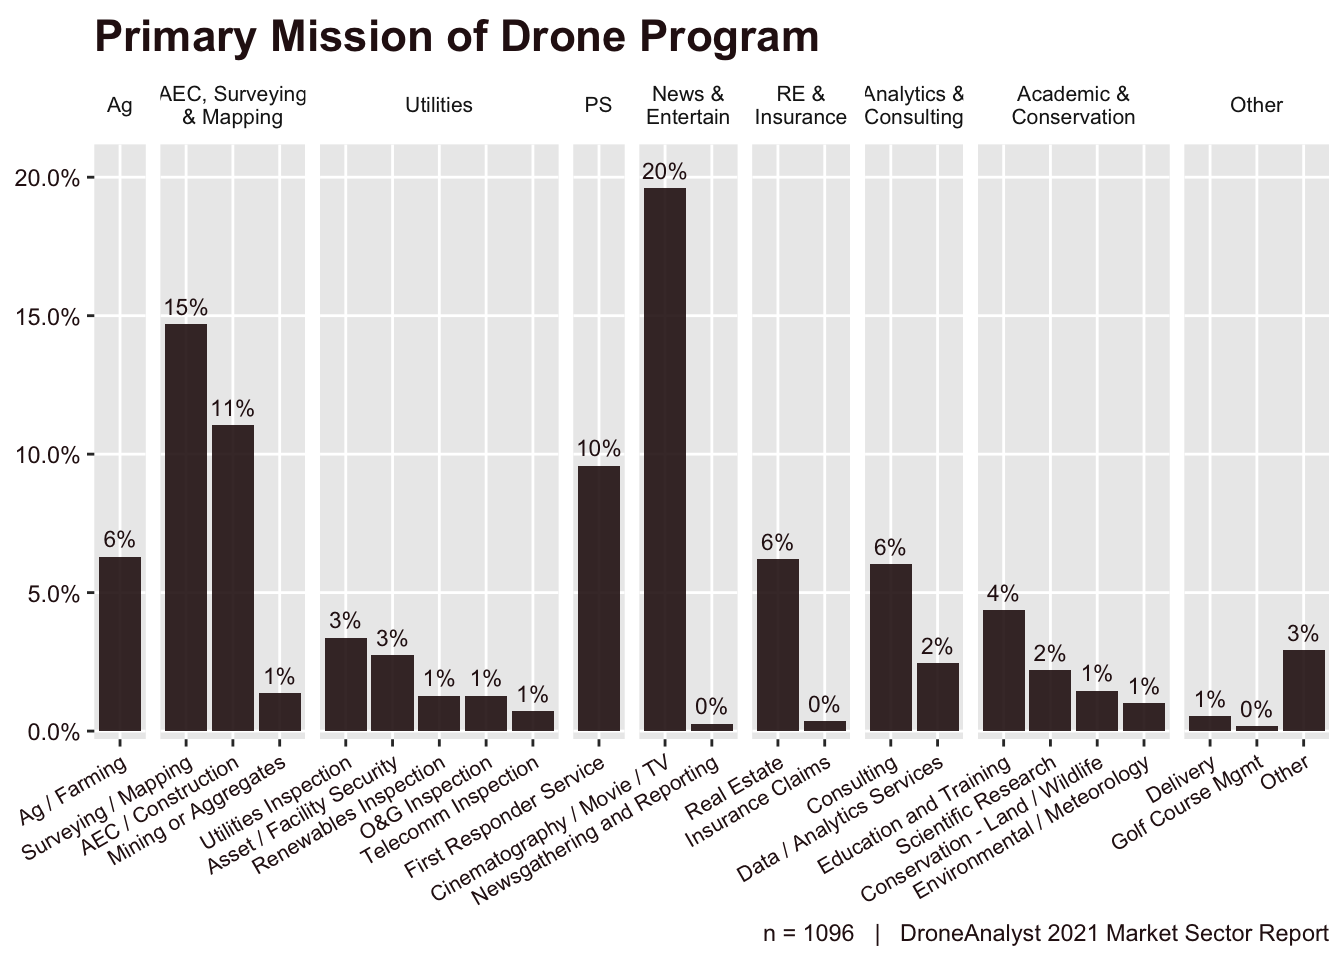
Figure 5.2 below explores the more nuanced missions respondents selected to fit into these broader sectors.
This chart can’t tell us much more than our initial figure in this section, but it can be interesting to see what keywords users in a sector chose. For example, in the AEC, Surveying and Mapping sector, users were more likely to choose Surveying and Mapping than of AEC / Construction, which speaks to how these users categorize their work. This trend was much more pronounced among drone buyers, signifying that business and agency users had a more even approach.
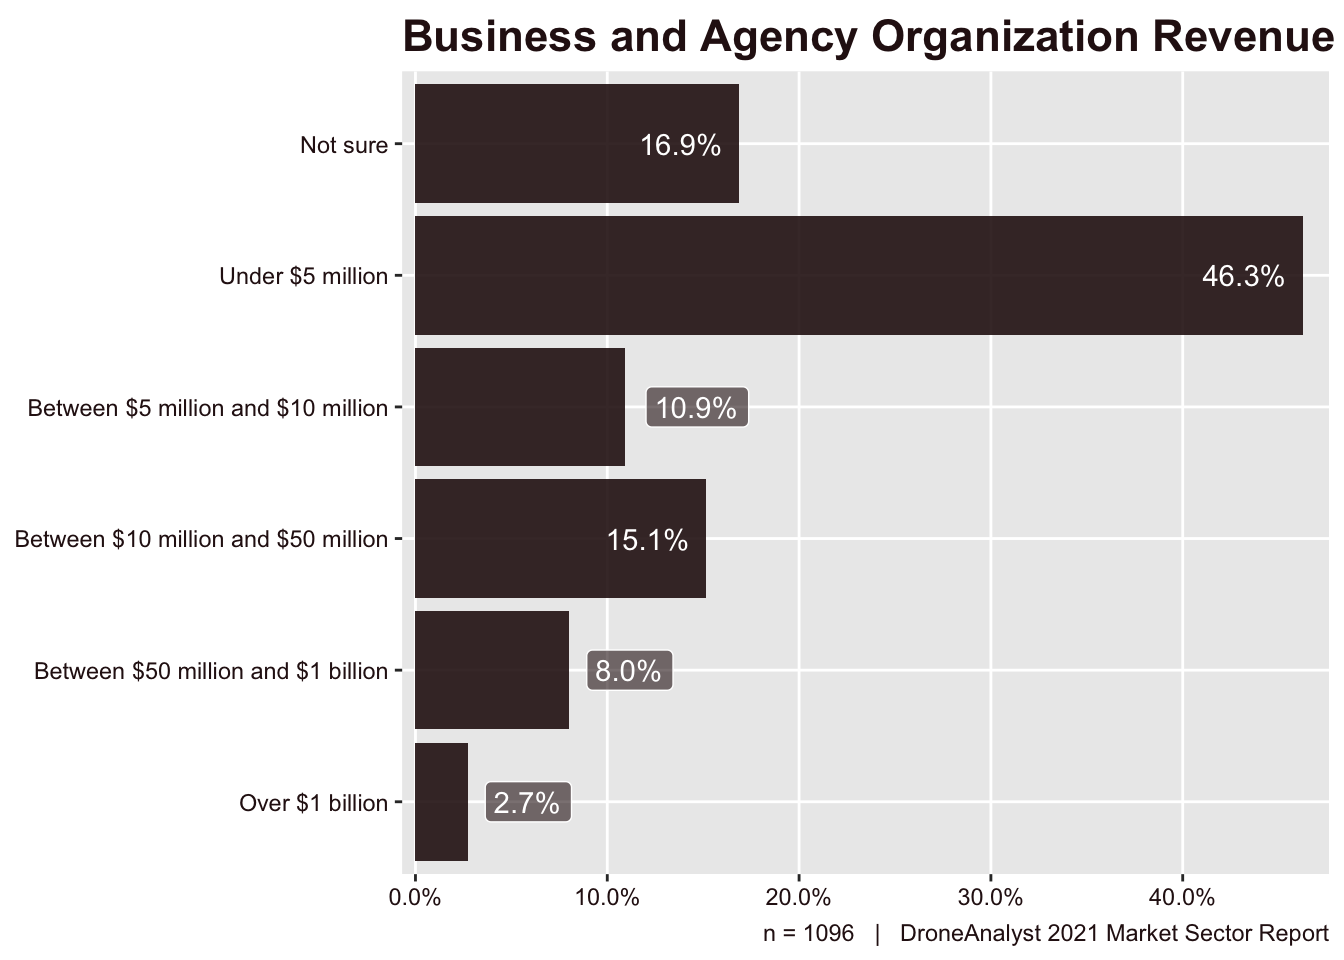
Next we wanted to better explore the size of the organizations using drones. This doesn’t just mean their drone operations, but the broader organization. We learned about this by asking respondents about their organization’s revenues or agency budgets. The findings are displayed below in Figure 5.3.
We note that 17% of respondents indicate they are “not sure” of their company’s revenue. This may be because many respondents are employees and not principals of the business. This figure was lower than last year (32%), which may signify that the overall seniority of respondents is higher (Figure 1.5), but this is the first year we asked a question around seniority, so we cannot say that is definitively the reason why.
Those participating in organizations with revenues below $5 million are the largest group by far. This makes sense when considering that many respondents are from a surveying firm, media agency or public safety agency, which tend to be smaller organizations.
We saw the largest jump in respondents in organizations making between $10 to $50 million, jumping from 3.7% last year to 15% this year. The categories above under $5 million gained 18 points spread among them, signifying that we saw more responses from larger firms.
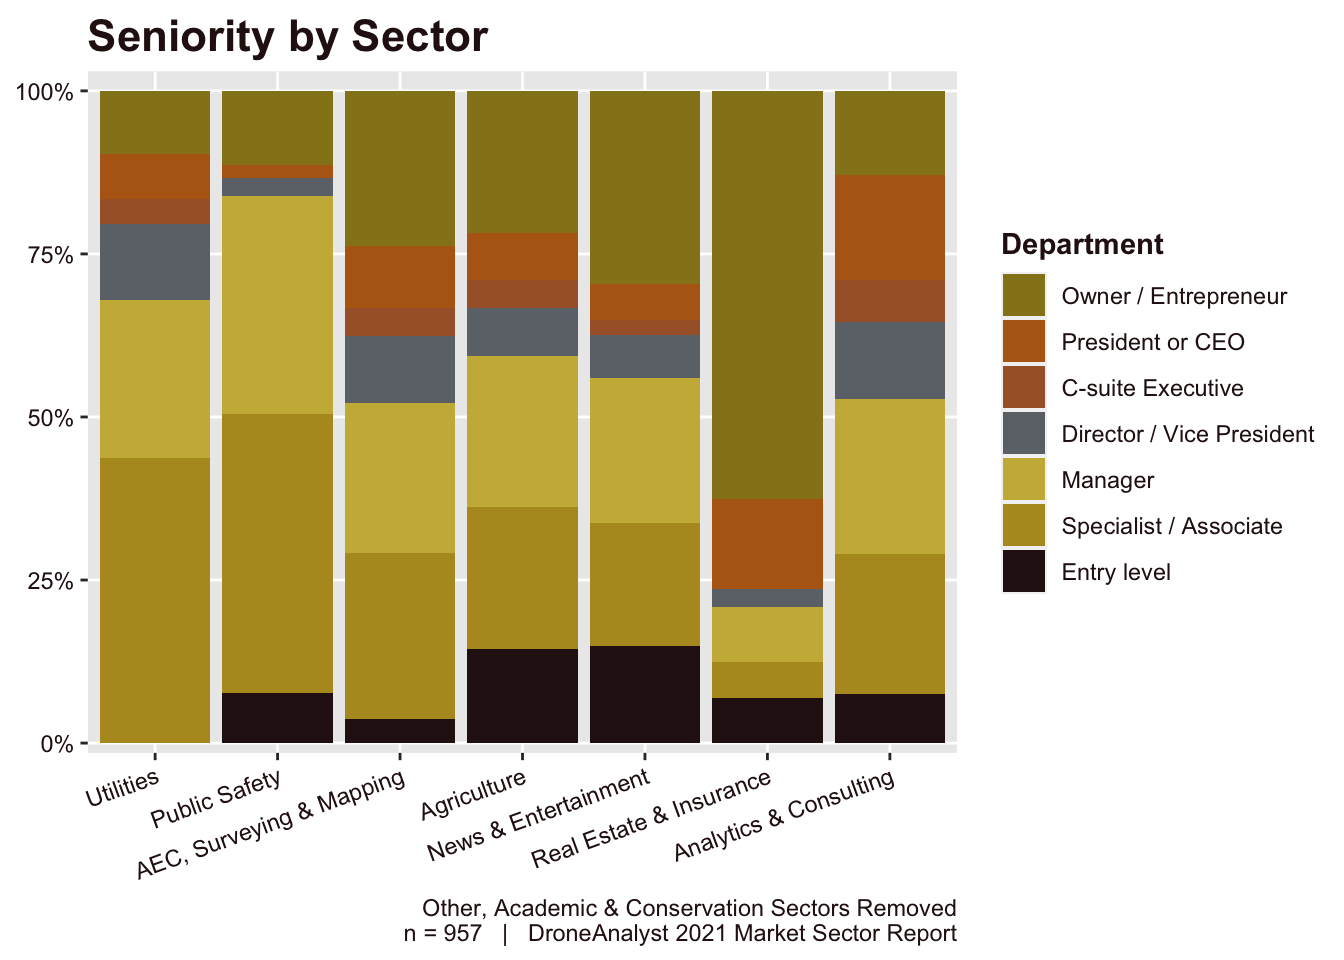
Lastly, to better understand who was representing their organization in the survey, we matched data around Seniority (Figure 1.5) and the sector of the respondent (Figure 5.1). This both lets us understand the qualifications of our respondents, and also tells us a bit about the internal structure of these organizations.
We see drastic differences in the seniority of our respondents, which also aligns with the size of these organizations and the structure of them. Where a drone program tends to be a side part of their regular operations (like Utilities or Public Safety), we see more responses from managers or specialists. This reverses for a sector like Real Estate, where a sole owner may also be a drone operator, or directly interfacing with service providers.
It’s notable that while there is some variation here, their influence on purchasing decisions were fairly similar across industries (Figure 1.6). As a manager at a Utilities firm may oversee all drone operations, they may have the same (or more likely more) purchasing power than a owner / entrepreneur in the Real Estate sector.
Program Maturity and Structure
We wanted to know the maturity and structure of drone programs in the industry, so we asked a series of questions to better understand this.
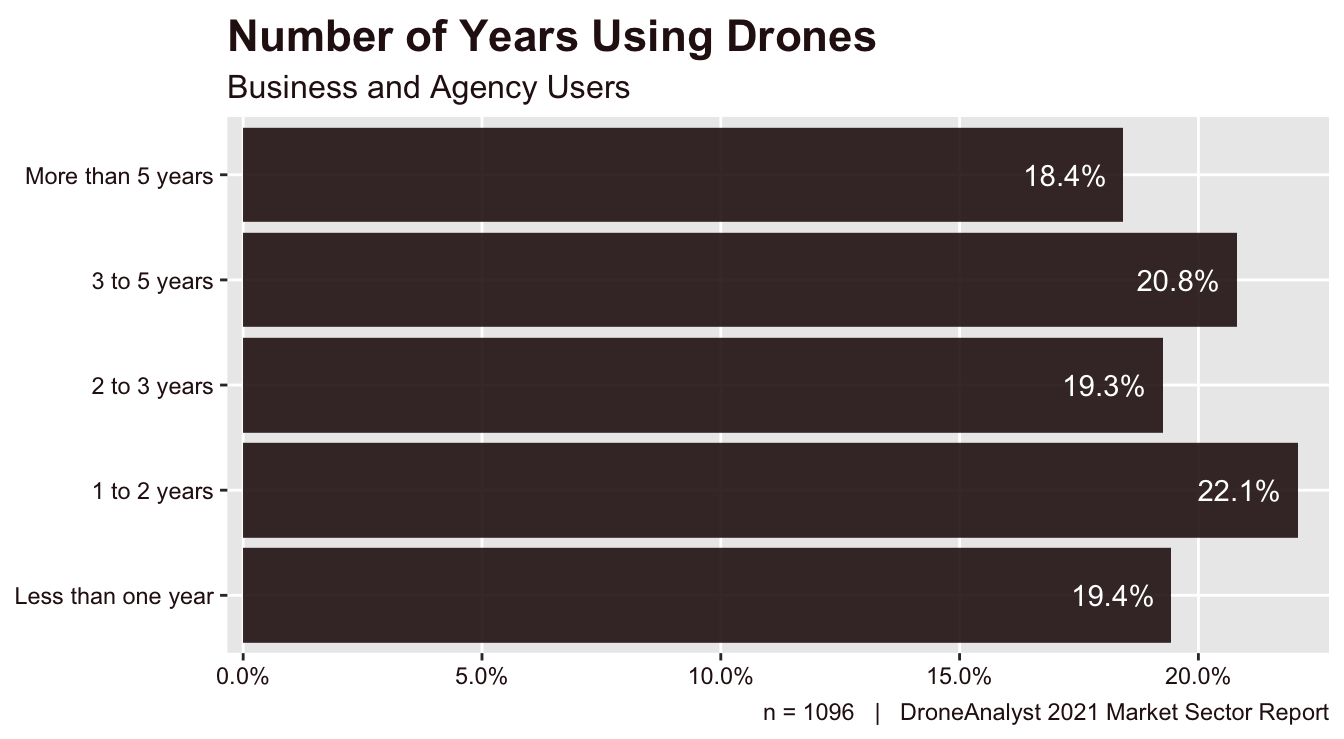
First, we asked respondents about how long they have had a drone program, with findings below in Figure 5.5.
The data shows a fairly even distribution across our categories. However, it is important to note that the time scales are not even, with 3 to 5 years representing a two year period instead of one. We have generally seen a higher concentration of drone programs having recently started a program in previous years. With nearly three-quarters (74%) of business / agency users in 2018 fitting into the first three categories. That dropped to 54% in 2020 and climbed again this year to 61%.
Part of this climb may have been COVID-19 spurring businesses to explore new technologies to address challenges faced by the pandemic, seen as a 3 point bump among users in 1 to 2 years category. We have seen a more pronounced uptick in service providers (Figure 6.3), where individuals could more easily explore the possibility of starting a drone business during a pandemic.
Another key way to see this data is to look back at the introduction of Part 107 in 2016 as the starting point for serious drone adoption. This would put the trailblazers who started a drone program immediately into the last two categories. We don’t see a big jump here, but more of a steady increase in adoption.
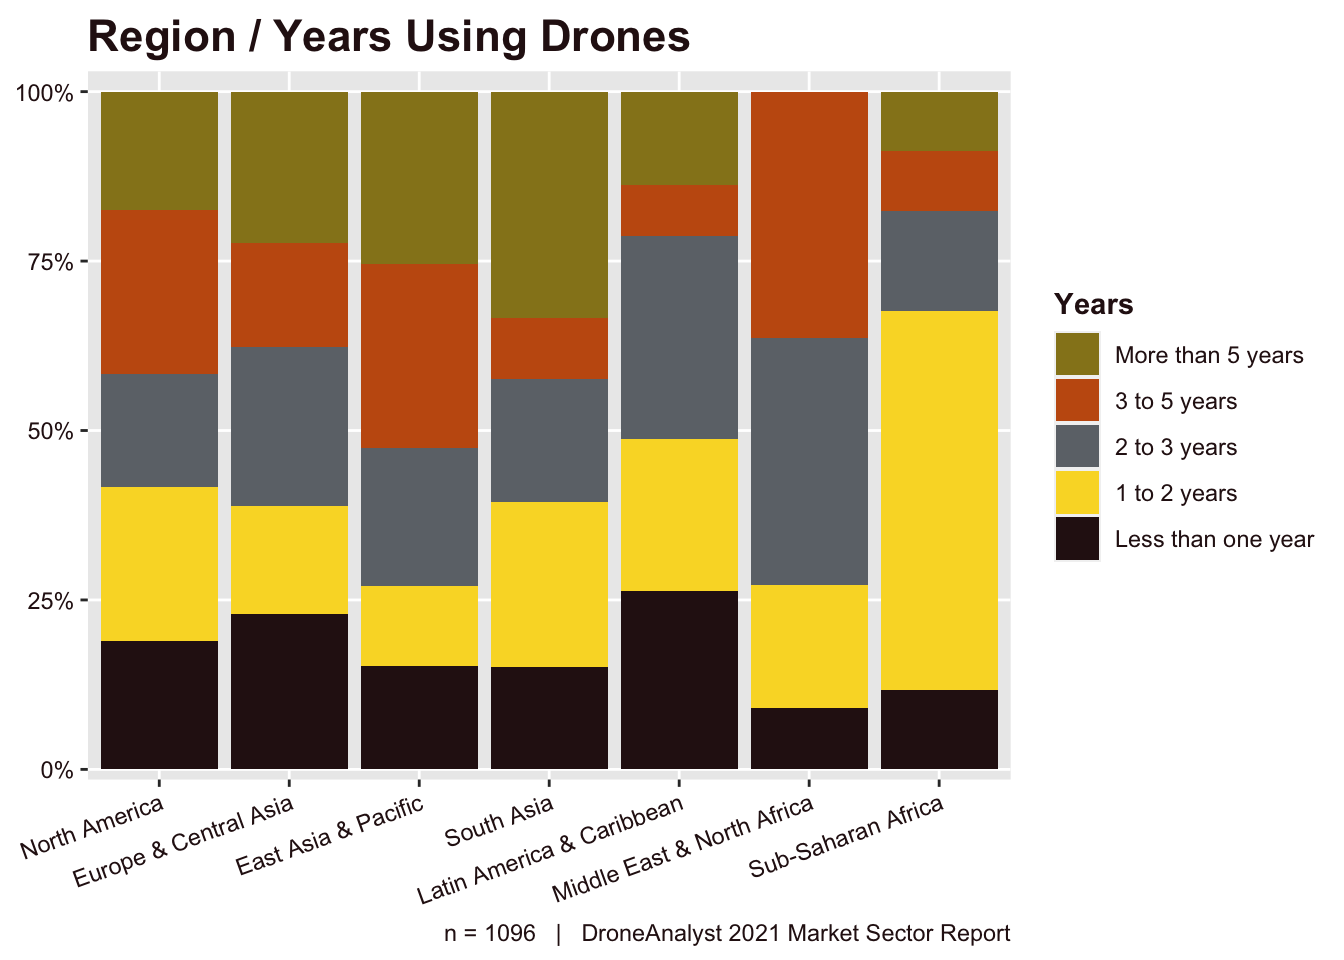
To extend this US-centric look to more broadly look at the impact of regulations on program maturity globally, we created Figure 5.6 combining the region a respondent is from and the number of years their organization has had a drone program. As new regulations in various regions impact adoption, this is a critical way to see how they might spur new programs being set up.
From this figure, we can see that South Asia and Europe have a larger amount of new drone programs than North America. For Europe, if we take into account the new EASA regulations announced last year, we can see the impact as businesses start to more serious consider drone programs.
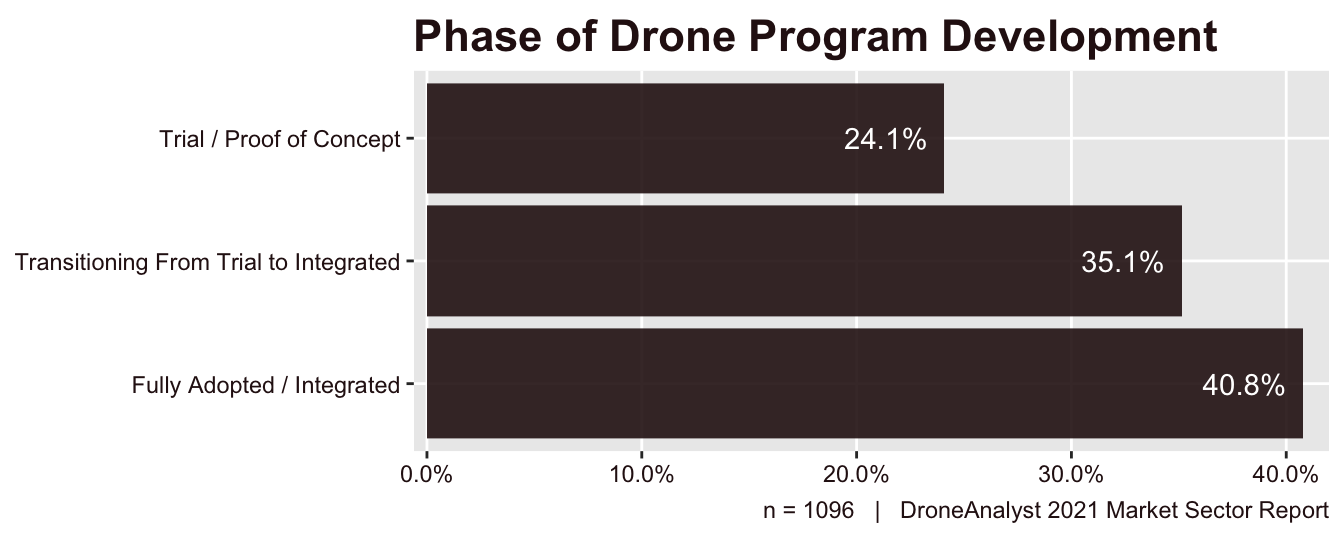
Next, we asked respondents to indicate the current stage of their drone program. Respondents could choose only one best answer. The results appear in Figure 5.7.
The data shows that less than a quarter (24%) of business and agency users of drones are in the trial / proof of concept stage of deployment, with he largest portion in the fully adopted or integrated stage. We haven’t seen significant movement from last year, as new programs will always start in the trial stage, but saw 3-point increase in the transitional stage.
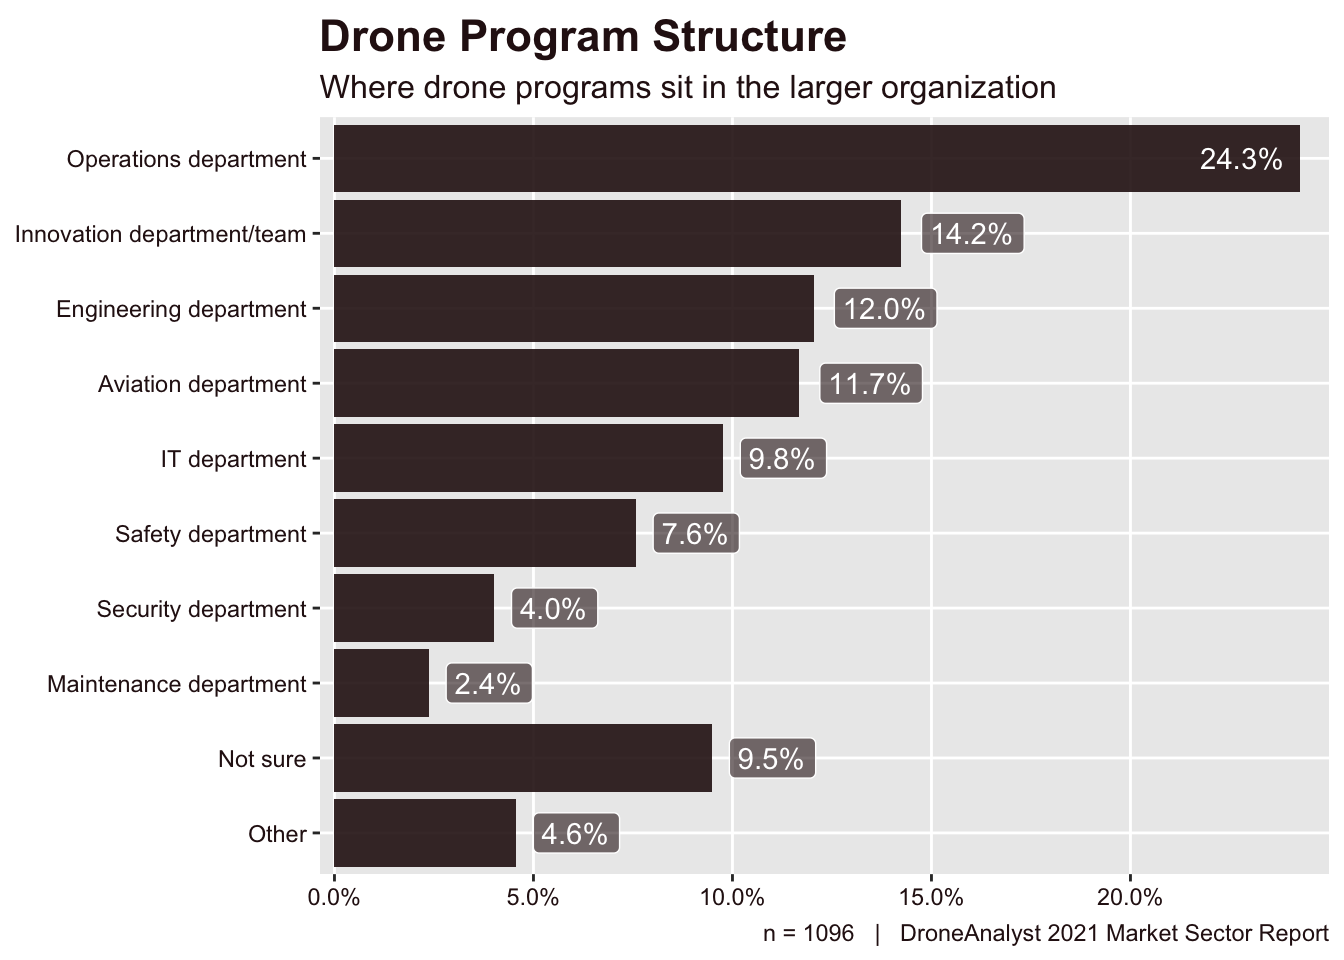
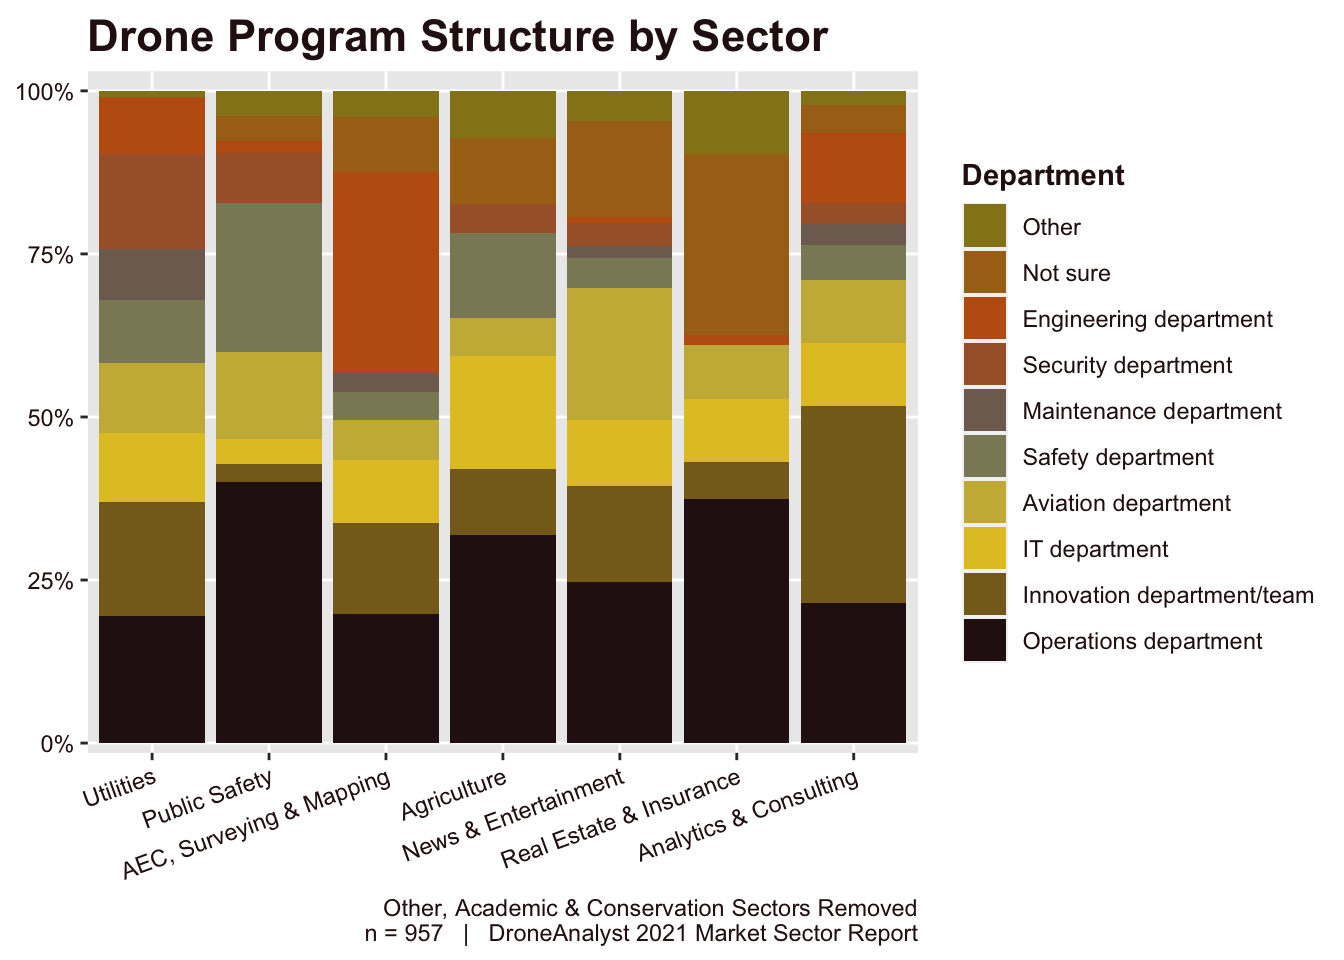
Additionally, we asked respondents about where their drone program sits in the larger organization chart. This is a new question designed to better understand both how deeply drones are being integrated into businesses and the value management sees in drones long term.
36% of respondents answered that their drone program is part of their organization’s larger Operations or Engineering department, suggesting deep integration into regular operations. It’s important to note that this almost matches the same portion of respondents who answered their drone operations were fully integrated from Figure 5.7 above.
We saw larger relative increases among innovation and aviation departments, with innovation departments now becoming the second most chosen department.
This datapoint can’t be taken in a vacuum, as it is highly subjective to the type of organization we are talking about. To better understand the relationship between where a drone program sits in the larger organization and the sector the organization is in, we matched this data to the sector the organization operates in (Figure 5.1). This is displayed below.
There is a whole lot to explore here, more than we can spend time on. We suggest you dive deep into the sector(s) that most impact your business. Some areas of particular interest is the large portion of public safety agencies tying their drone program to their safety and operations department, with safety department being an outlier when compared to other sectors. Utilities have fairly diverse structures, and are the few to rely on maintenance or aviation departments to oversee their drone operations.
Drones fit under the traditional IT structure most commonly among programs in the agriculture sector. And we see those in AEC, Surveying and Mapping most likely to fit their drone operations under their engineering department.
Service Model, Pilot Sourcing and Training
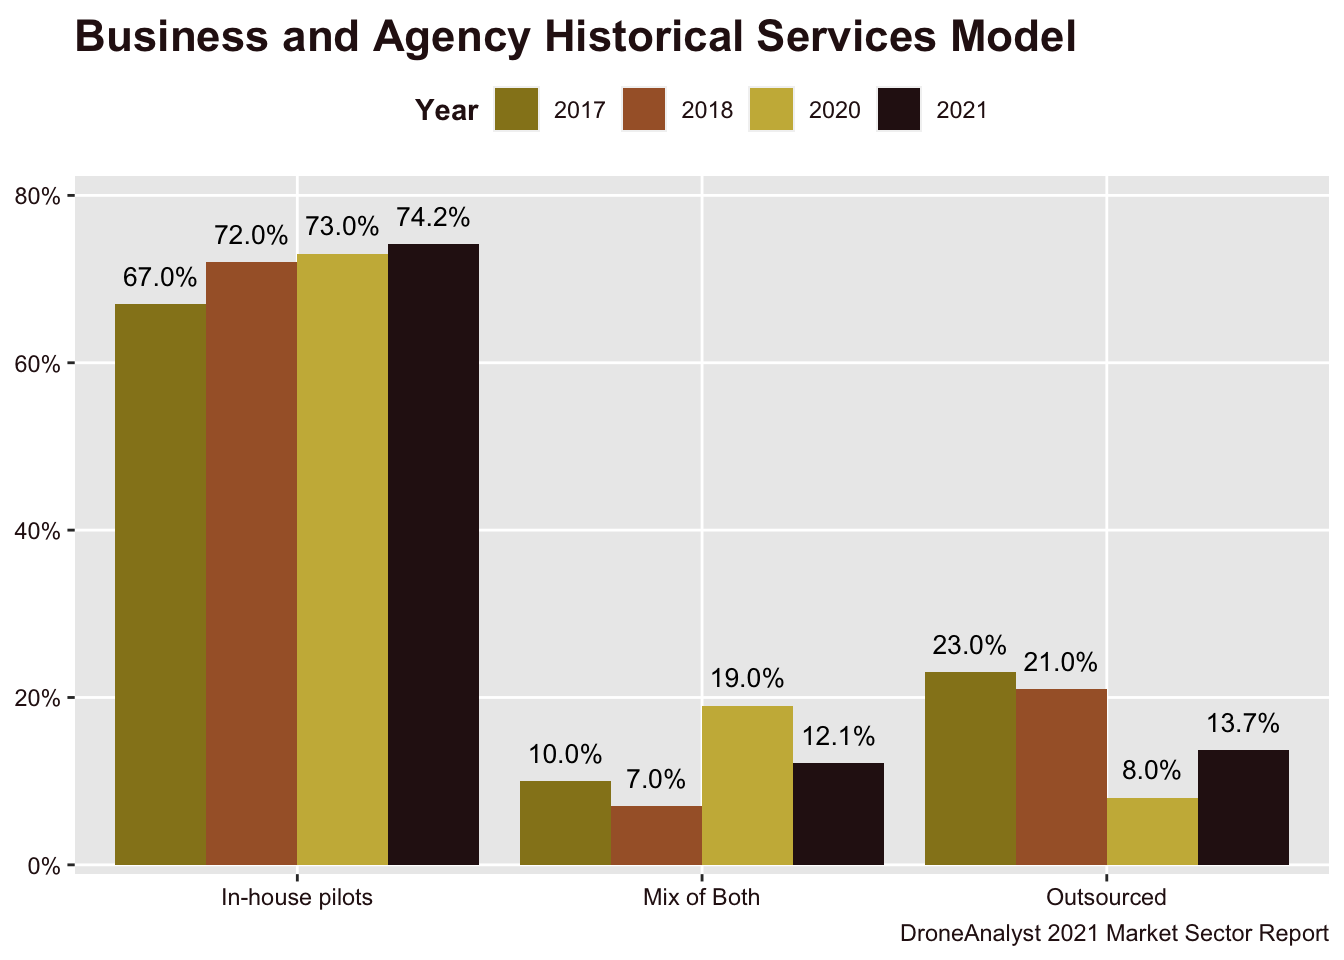
We asked business and agency users if they perform their drone-based services themselves, through contractors or a combination of both [Q35]. The results from all previous reports can be found in Figure 5.10 below.
In 2020, we saw a broad trend to internalize services, either by growing in-house operations or moving from a solely outsourced model to a mixed model. This year generally sees this trend continue, but we do see that programs that rely primarily on outsourced services grew, although not to the levels seen in 2017 and 2018.
With this data in hand, we analyzed responses to learn what services are most likely to be outsourced. Table 5.1 shows the five services that are most likely to be outsourced.
Table 5.1: Top 5 Drone Services Outsourced by Business and Agency Users
|
Primary Mission
|
Ratio
|
|
Cinematography / Movie / TV
|
26.0%
|
|
Surveying / Mapping / Topography / Geospatial
|
14.7%
|
|
AEC / Construction (design, building, inspection, or monitoring)
|
9.3%
|
|
Consulting
|
9.3%
|
|
Public Asset and Infrastructure Management (security, surveillance)
|
6.0%
|
|
DroneAnalyst 2021 Market Sector Report
|
We saw some big movement on these figures compared to years prior, which were dominated by users in the utilities sector. This was largely due to many of these organizations moving more towards a hybrid model, and a large increase in outsourcing among the industries listed above.
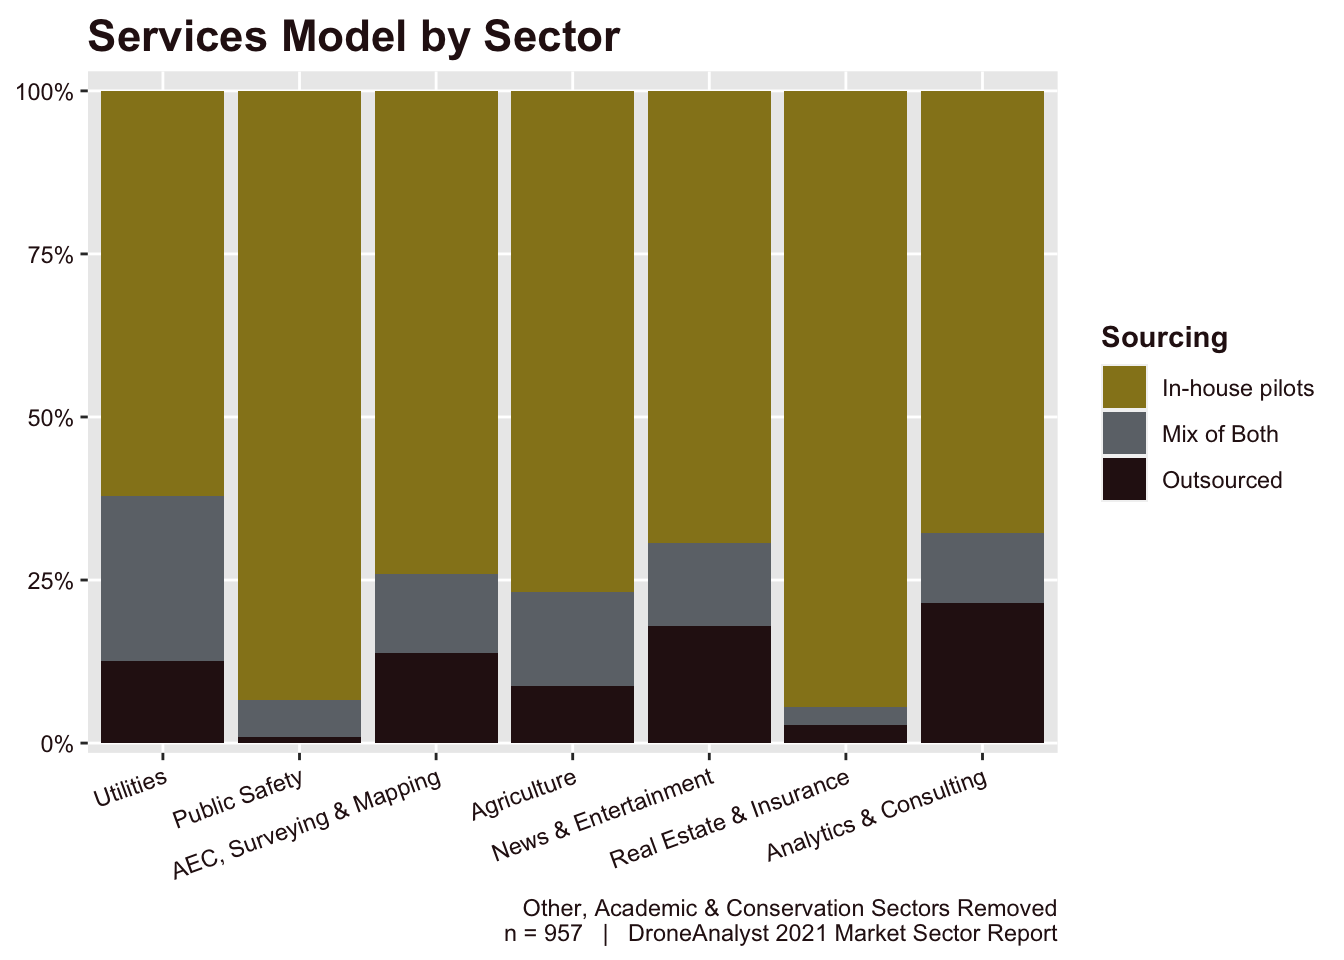
To better highlight the breakdown of how the services model changes by broad sector categories, we prepared Figure 5.11 below.
Here we can see that while organizations in the utilities sector relied less on solely outsourcing their services, they were the most likely to use some form of outsourced services model, with a higher emphasis on the hybrid model.
Many other sectors followed closely behind the Utilities sector, with the exception of public safety and real estate organizations, which tended to solely rely on in-house pilots.
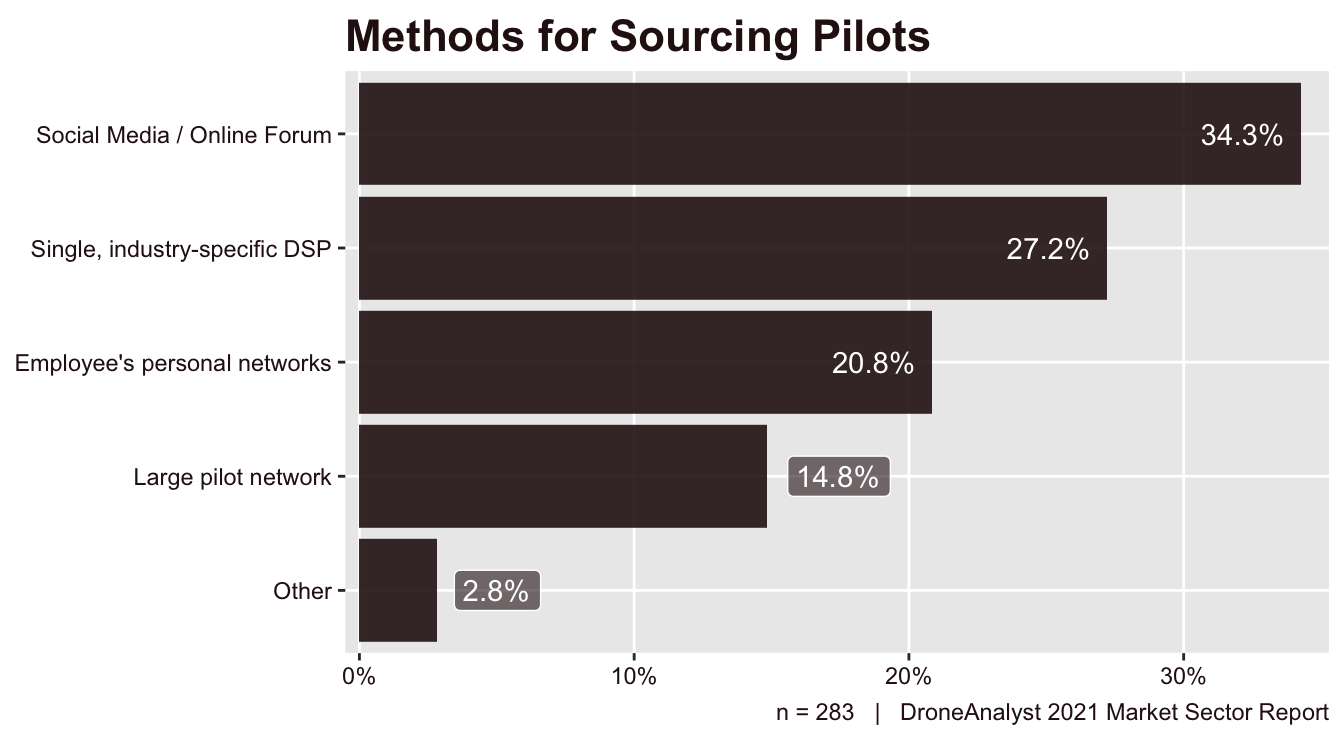
To better understand how business and public agencies tapping into outsourced pilots are sourcing these pilots, we asked a follow-up question to those organizations who are either primarily using outsourced services or are taking hybrid approach. We listed several, common methods for sourcing pilots, and also allowed respondents to write in an option if their method didn’t match. The results are displayed below in Figure 5.12.
Methods for sourcing pilots were fairly informal and grassroots, with social media and online forums being the leading method at roughly one-third (34%) of respondents. When combining this category with employee’s personal networks, these less formal sourcing methods made up over half (55%) of all outsourced services.
We also found that, when a large drone service provider was used, organizations were more likely to choose a industry-specific DSP (think a CyberHawk) instead of a generic drone pilot network. It is important to consider that organizations may have different views around which drone service provider fits into which category, as we are seeing large pilot networks like DroneBase become increasingly focused on particular industries and clients. So to some customers they might fit into the industry-specific category, but for others the large pilot network category. When combining these two categories together, they made up 42% of all methods for sourcing outsource pilots.
This is an interesting way to look at the demand for outsourced services, we also explore this question from the supply side in Section 6 on Service providers, particularly Figure 6.9 which explores participation and reliance on pilot networks for drone pilots.
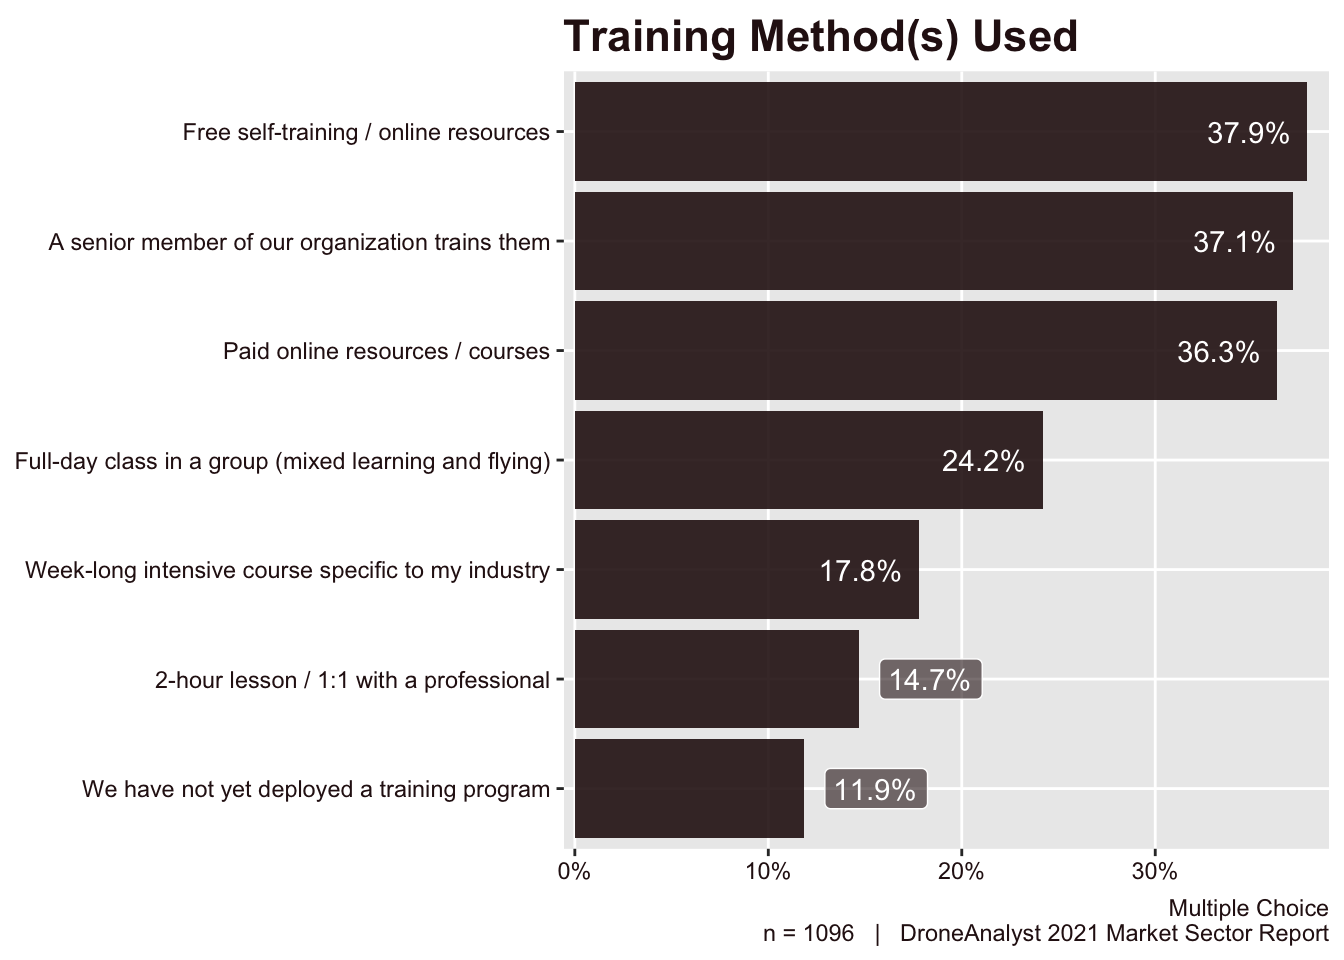
Last in our efforts in exploring the services models for business and agency users, we are diving into the training methods used to support drone operations. We listed several common, broadly defined categories for training methods and let respondents select all the methods they are currently using. The results are displayed below in Figure 5.13.
The top three most common training methods range from free external and internal resources to slightly more advanced paid resources.
More advanced training methods are still used only a minority of the time, however it is good to see that full day classes with flight experience has nearly risen to a quarter (24%) of all business and agency users. Similarly, the highest investment training method - week-long course - has almost been used by nearly a fifth (18%) of all business and agency users.
It is a little concerning that 12% of these organizations have yet to deploy a training program, but that doesn’t sound as bad when considering that nearly 20% of business and agency users started their drone program less than a year ago (see Figure 5.5).
Drone Program Size and Scale
We wanted to better understand the size of the drone program. This is separate from our understanding of the organization that we ran in the first part of this section, as it is focused on the size and scale of solely their drone related operations.
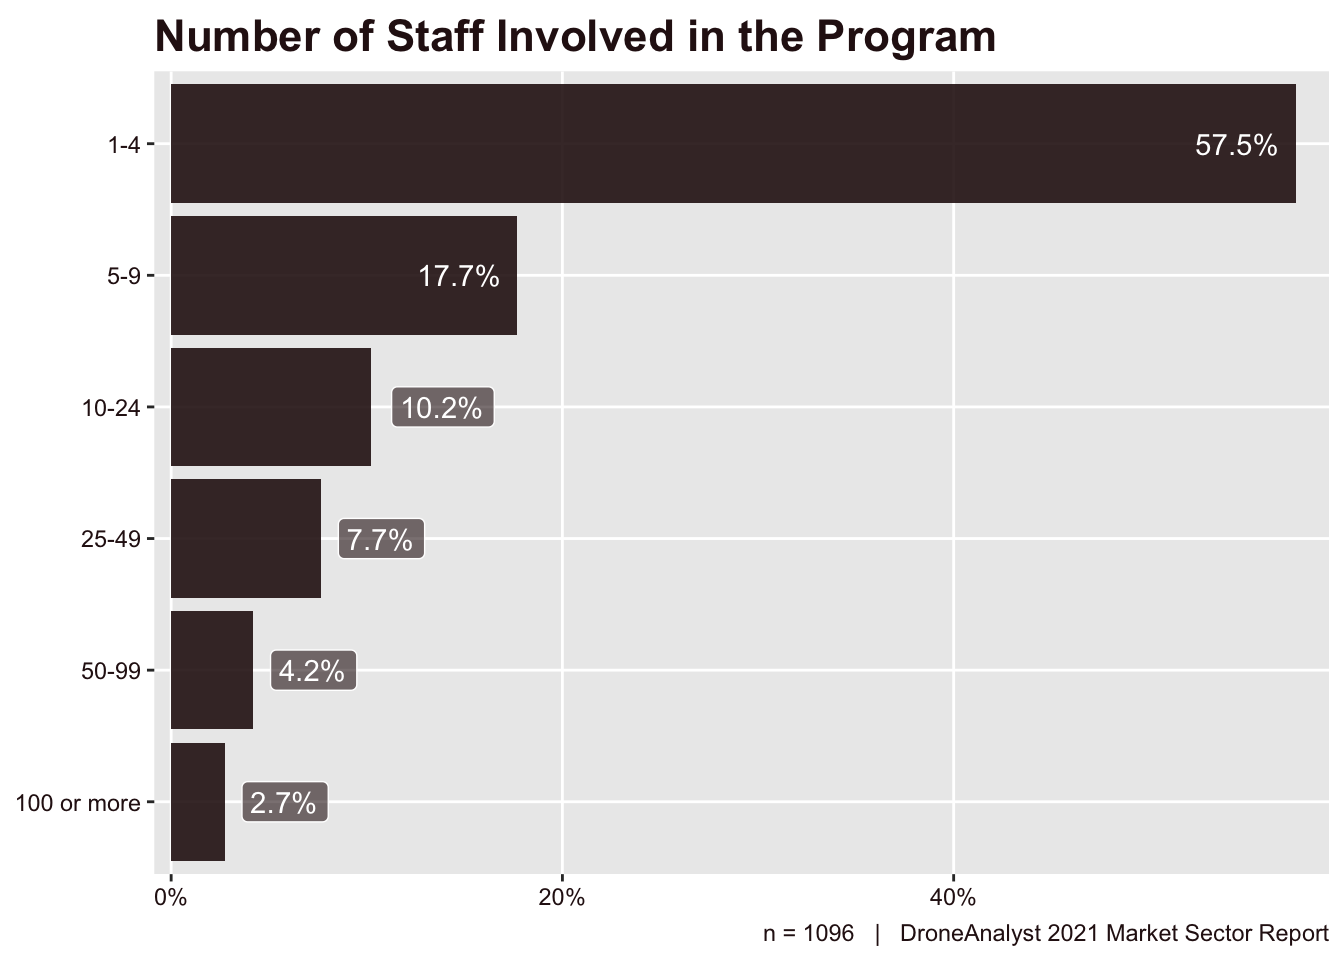
First we learned more about the amount of full-time, part-time and contract employees involved in the use or management of drones within the business or agency. This is displayed below in Figure 5.14.
The majority of drone programs rely on a small, core team to oversee their drone program. Compared to previous years, we do see a small trend towards larger drone management teams, with a 11-point drop in the 1-4 category, and increases across all other categories. This is a continuation of the same trend we saw last year, where the portion of business and agency users with just 1-4 employees involved moved from 76% in 2018 down to 68%.
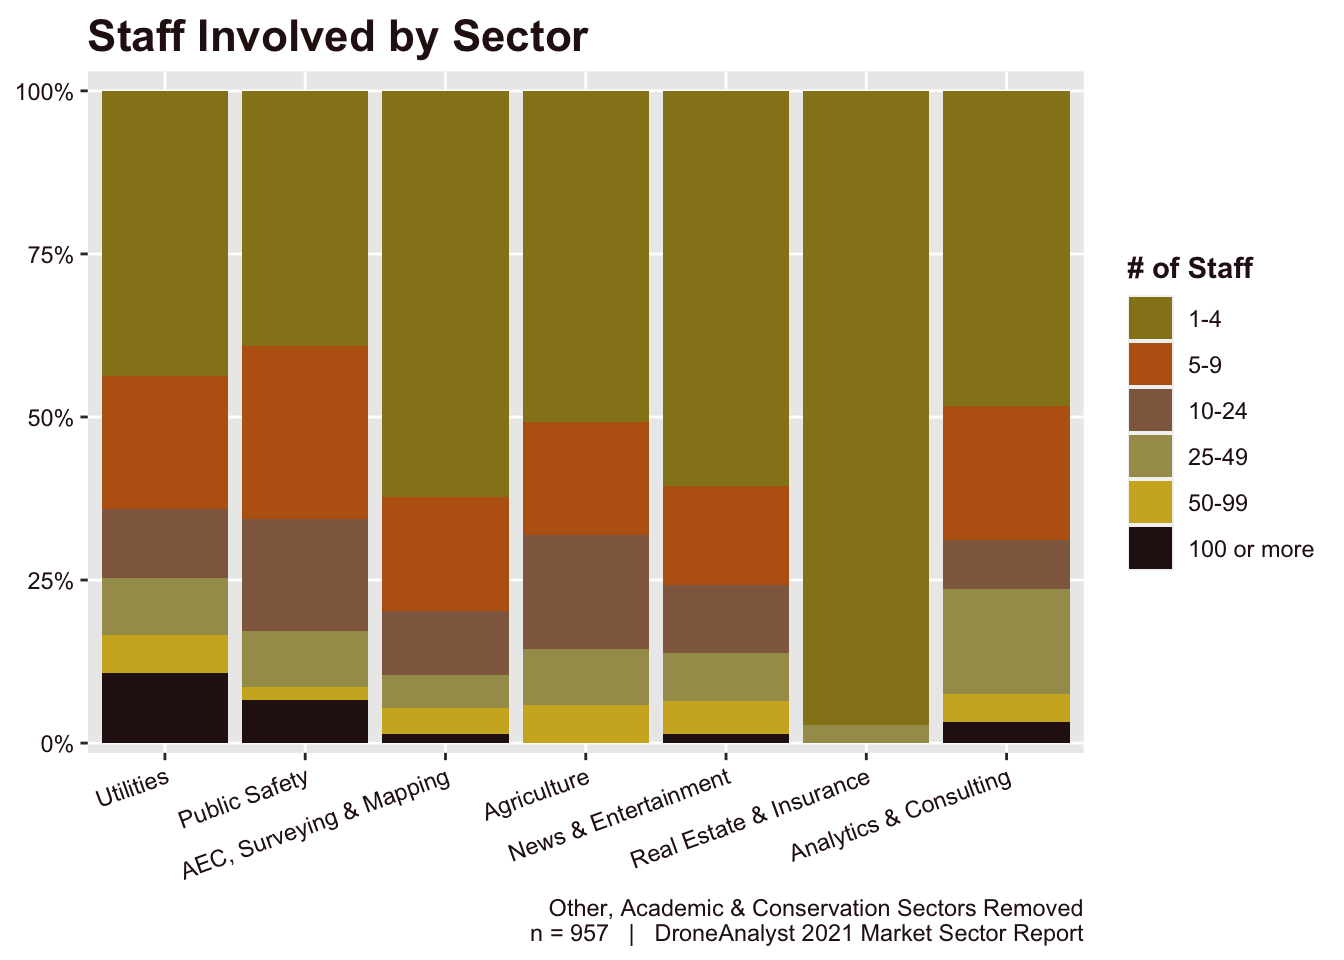
Overall the median number of staff involved was the 1-4 category, but this changes when we start to split this data out by sector. We took this approach in Figure 5.15 below.
Organizations in the utilities and public safety sector on average had 5-9 staff involved in their drone program, notably higher than the average. We also see some variation in the distribution of responses, with 25% of utilities having more than 25 staff involved, and a higher likelihood to have more than 100 staff involved.
While public safety agencies were the most likely to have more than 4 staff members involved, due to the localized nature of these organizations, they are mostly gathered in the 5-9 or 10-24 categories and few tend to have grown beyond that size.
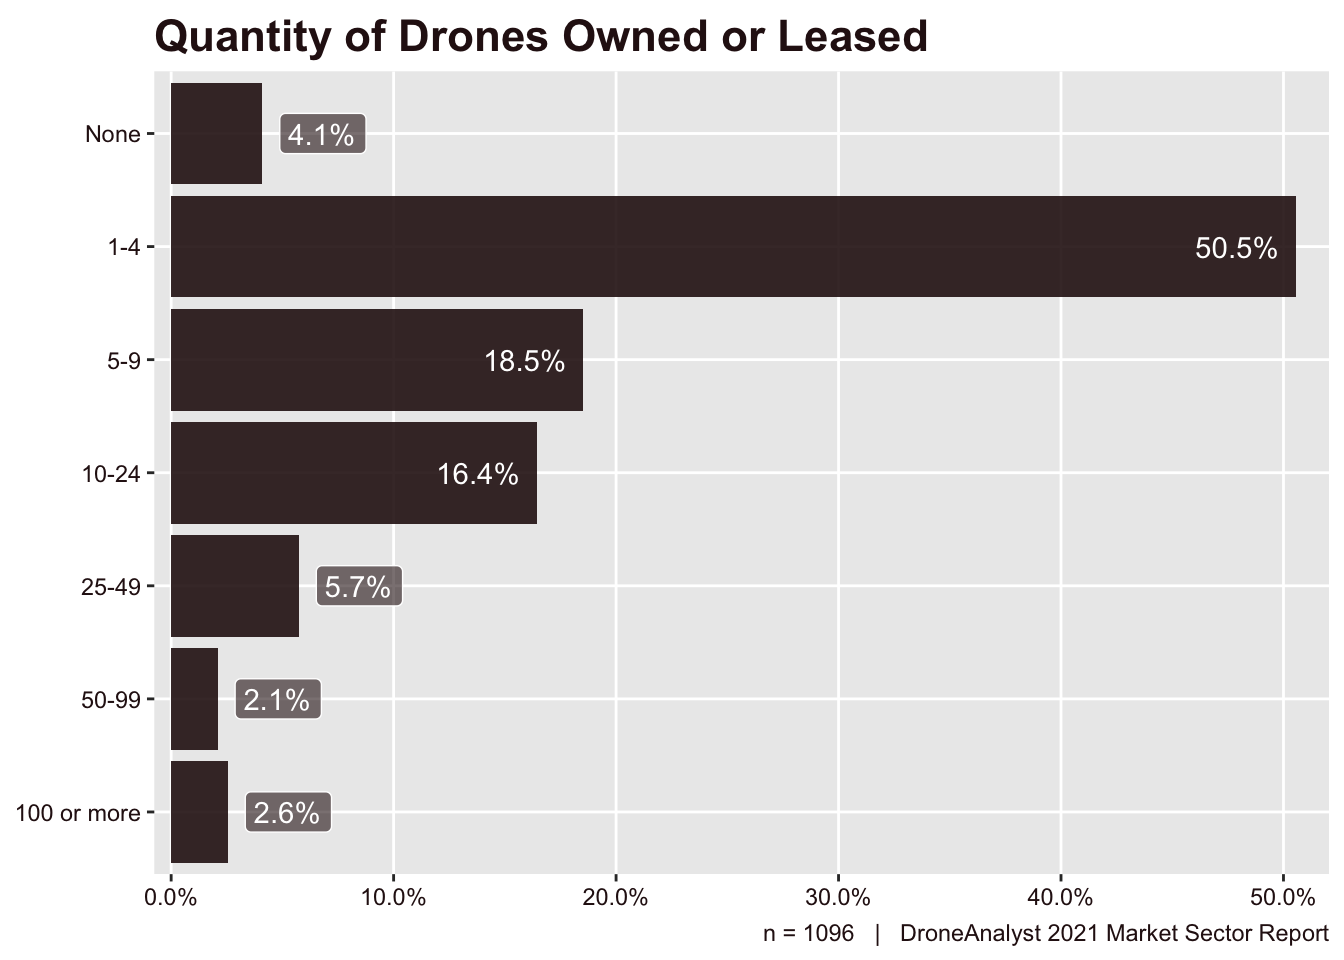
Next, we explore the size of drone fleets, counting both owned and leased units. Our (previous analysis)[https://droneanalyst.com/historical-performance-of-the-american-uas-industry] of data from the FAA on drone registrations per pilot indicates that the average drone pilot owns 2.3 drones. Therefore, we should expect these numbers to be larger than our findings above related to the number of staff. We explore this below in Figure 5.16.
As expected, we generally see that fleet sizes outside the number of staff. However, due to the increasing size of the categories used, we can’t exactly see this doubling effect immediately.
We saw similarly large growth in fleet sizes this year. In 2018, three-quarters of business and agency users had either 1-4 drones or none. In 2020 that dropped 10 points to 65%. In 2021, it’s now almost half at 55%.
The largest growth is among organizations deploying 5-24 drones, which jumped 8 points this year to make up nearly one-third (35%) of all business and agency users.
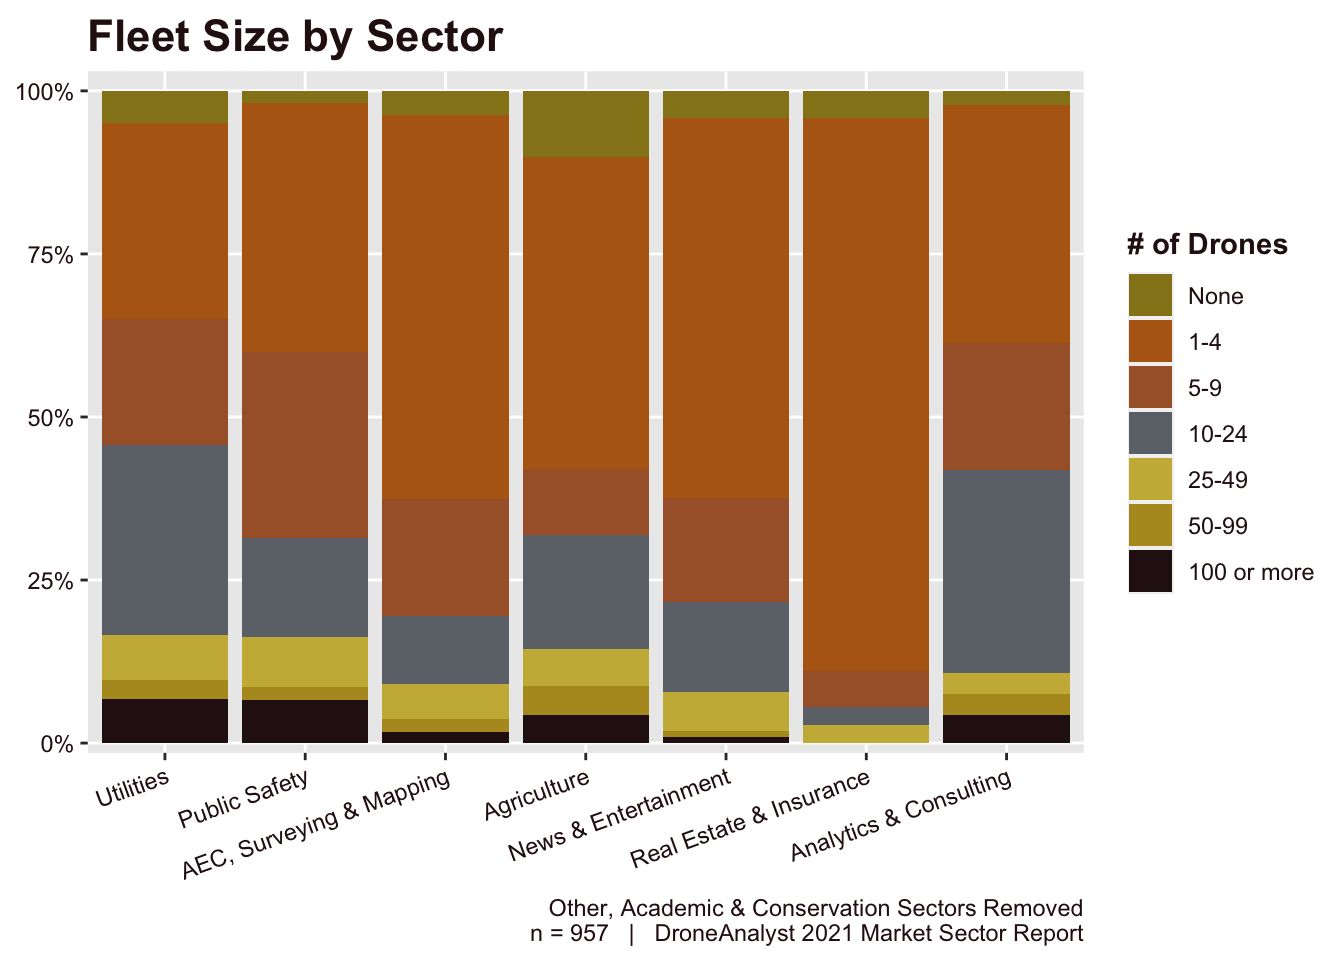
Similar to our analysis of staff numbers, we wanted to see how this splits out by sector, which is included below in Figure 5.17.
Here we can see fairly similar trends to those seen in Figure 5.15 breaking out the number of staff by sector. Utilities is the overall leader in the quantity of drones deployed and staff employed as part of their drone program. This graph can also more clearly show the increase in fleet sizes overall when compared to the number of staff.
Similarly, these findings relate heavily to the size of drone program budgets and their growth prospects, which is the next topic that we will explore.
Program Budgets and Growth Prospects
One of the key metrics we track each year to determine the health and maturity of the industry is how much money business and agency users are spending on drone hardware, services and software, and their challenges and growth prospects for the future.
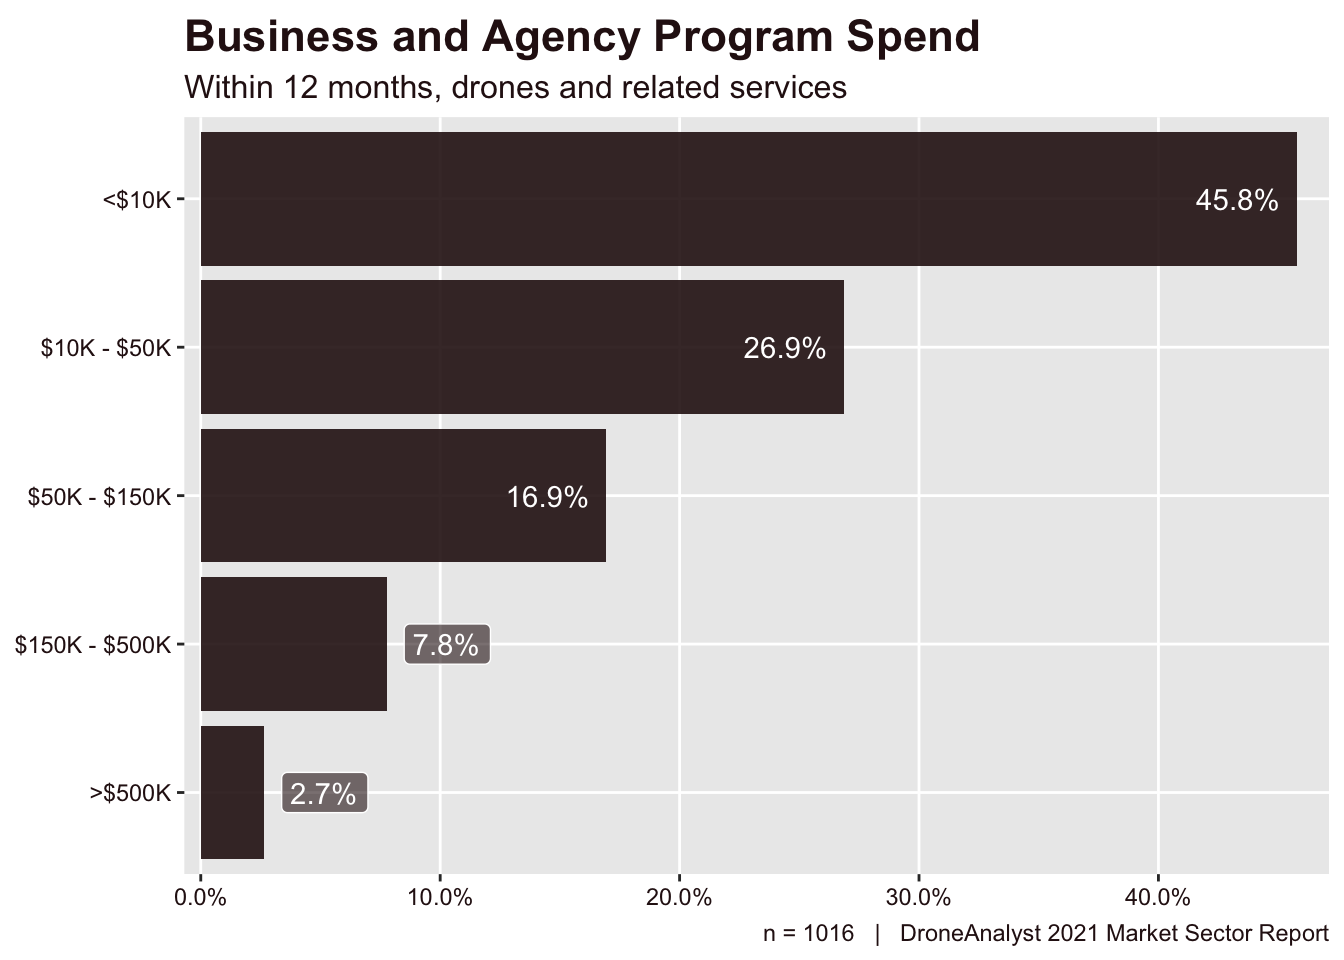
To start this section analyzing this topic, we first asked about how much drone programs spent over the last 12 months. 7% of respondents replied that they were not sure about the size of their organization’s drone spend (interestingly down from 15% last year), and have been removed from the results. The results appears in Figure 5.18.
While an initial look at this data may surprise a first-time reader that spending is low, this does represent some significant growth in drone budgets, and also correlates with other figures across the report (on drone price, staff involved, years of drone program, etc). Notably, this is the first time more than half (54%) of business and agency users spent over $10K in the past 12 months, up a large 11 points from 2020 and 21 points from 2018.
Maybe the best news for the industry is that this move out of the <$10K spending range isn’t moving to the next largest range ($10 - $50K), but instead we are seeing growth within the $50K - $500K ranges, growing at a combined 12 points.
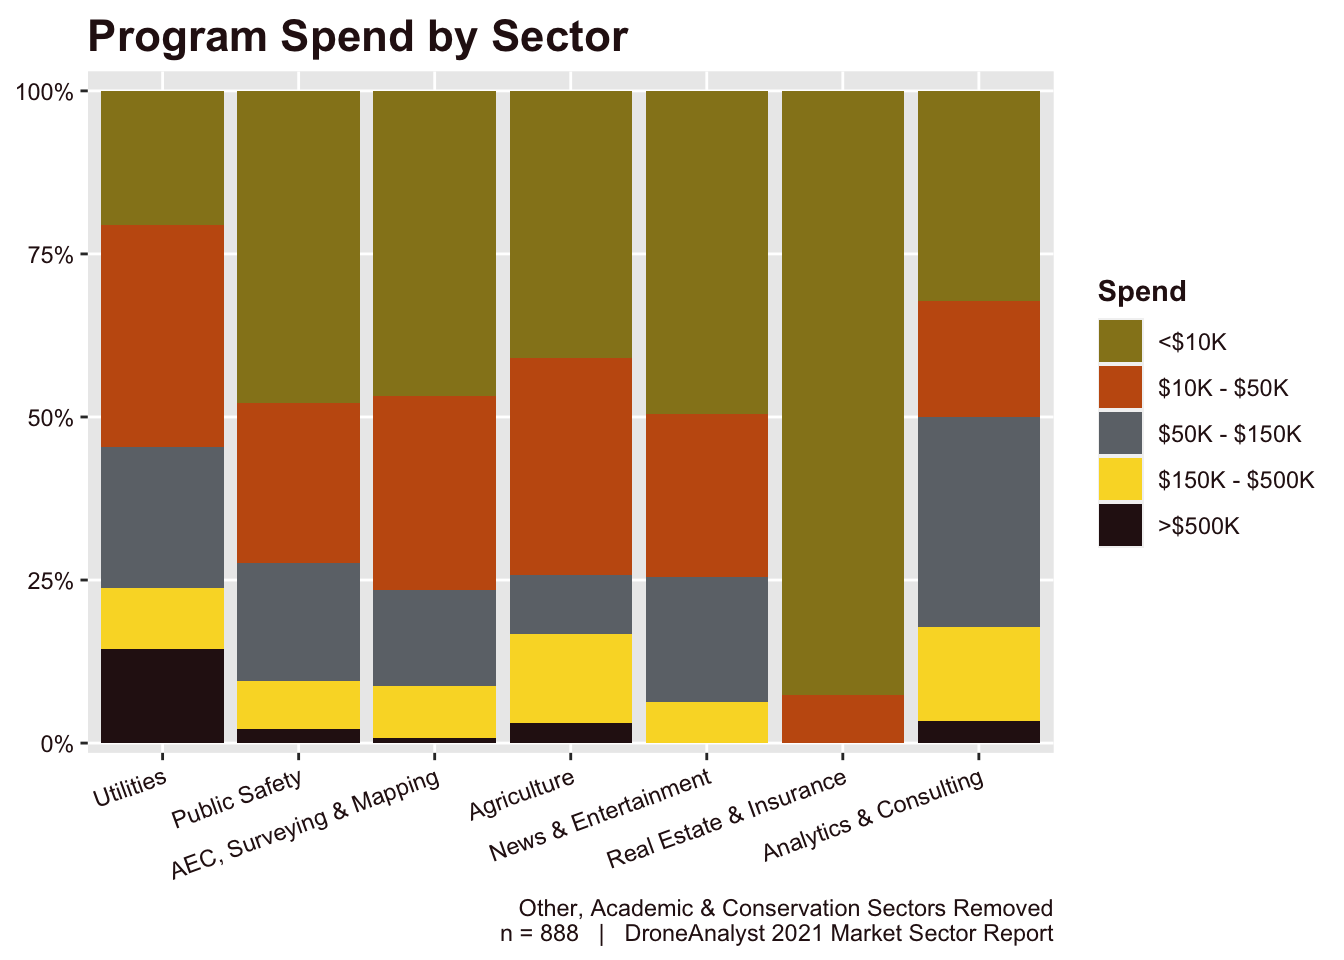
Program budgets vary widely across sectors, so we explored the relationship between spending and the sector of the organization in Figure 5.19 below.
Just as we saw with the number of staff and fleet sizes, utilities lead the drone spending charge, with the most amount of organizations outside of the <$10K range and a sizable 14% of these organizations spending more than $500K USD. Utilities are closely followed by analytics and consulting firms, which tend to overlap with firms in the utilities space.
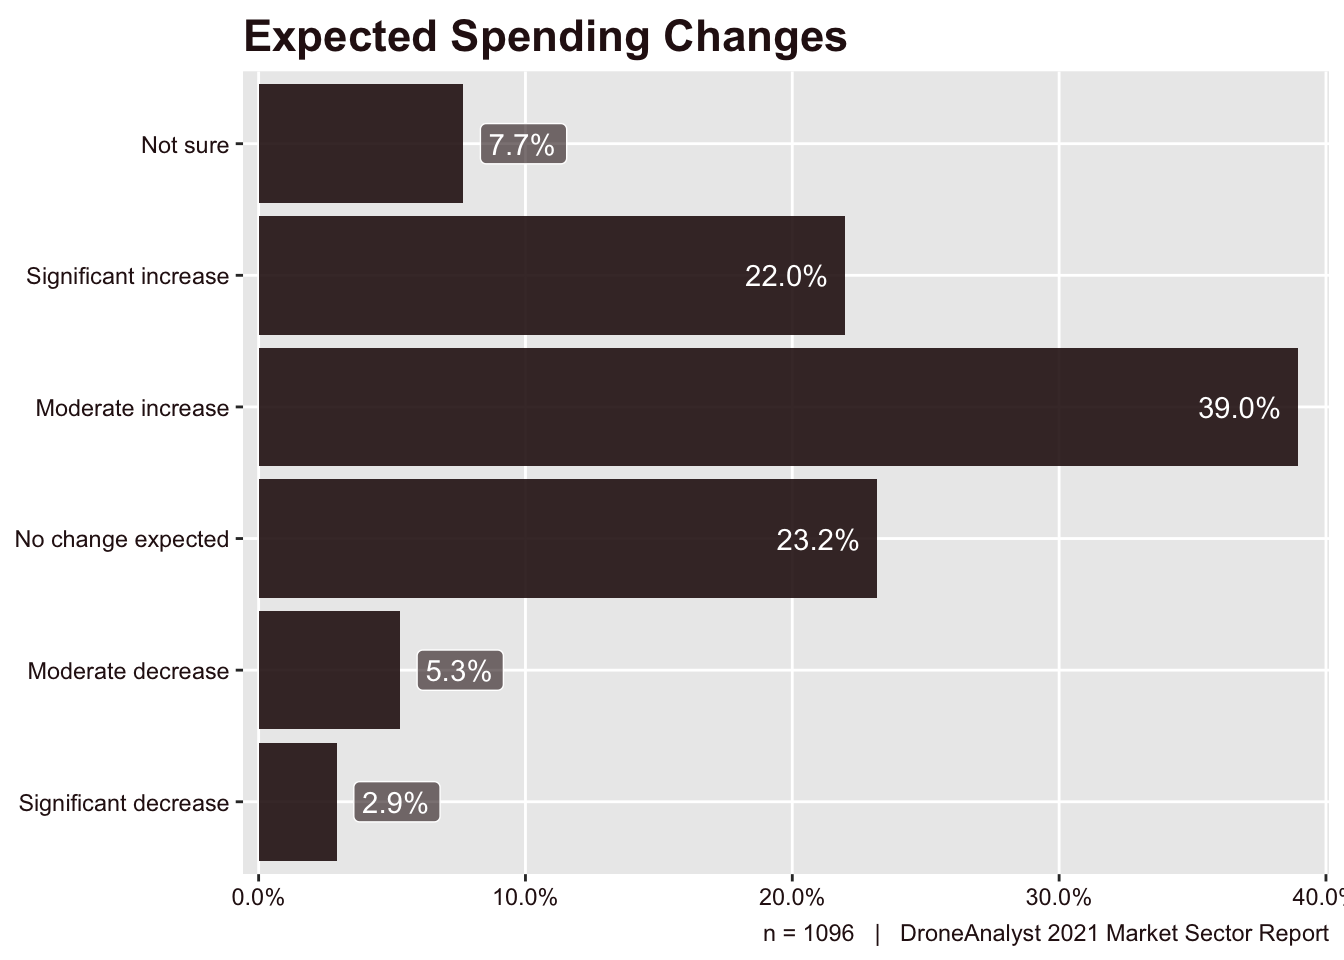
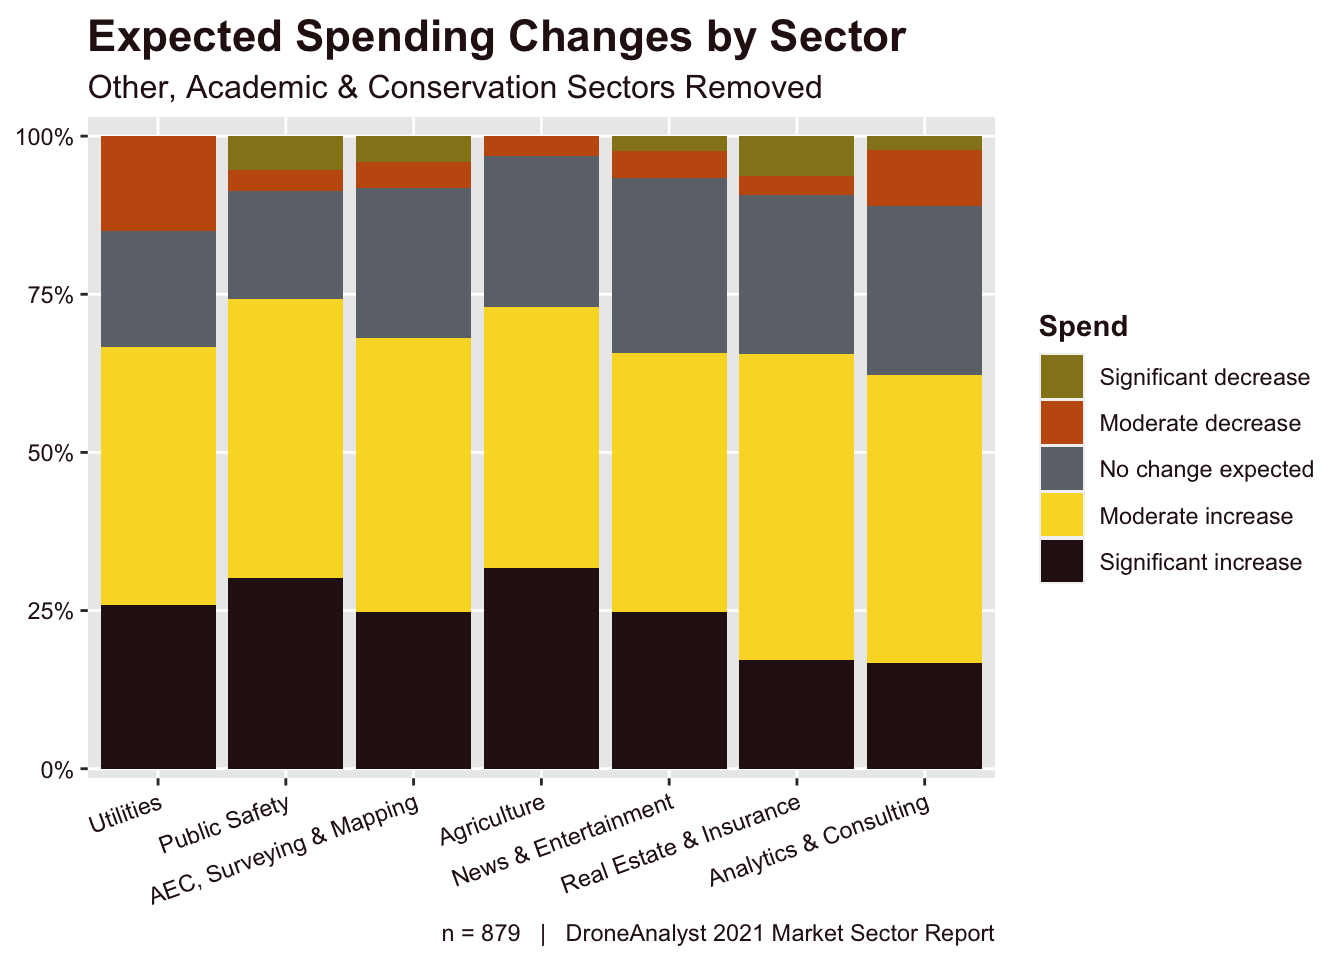
Next, we asked business and agency users about their expected spending changes over the next 12 months and their responses are below in Figure 5.20.
Nearly two-thirds (61%) of respondents answered that they expect a moderate or significant increase in their drone spending, a positive sign for the industry and a 4 point increase from 2020. The remaining responses were primarily no change expected or not sure, with only 8% of respondents expecting any form of decrease in their spending.
To look out how expectations vary across sector, we broke this down further in Figure 5.21.
The key colors here to watch are yellow (moderate increase) and orange (moderate decrease) which can give you a quick sense on the sector differences. Most notably, while utilities have spent more this year, they were also the most likely to expect some form of a decrease in their budget next year. This may be related to oil and other commodity prices, which will impact the underlying profitability of the business, regardless of the drone program’s performance or benefits.
Public safety agencies were most likely to expect an increase in their budget. This may surprise many not involved in the industry who feared that public concerns or social movements may impact drone spending. From our conversations, there are a multitude of reasons why that isn’t so, and our data reflects that.
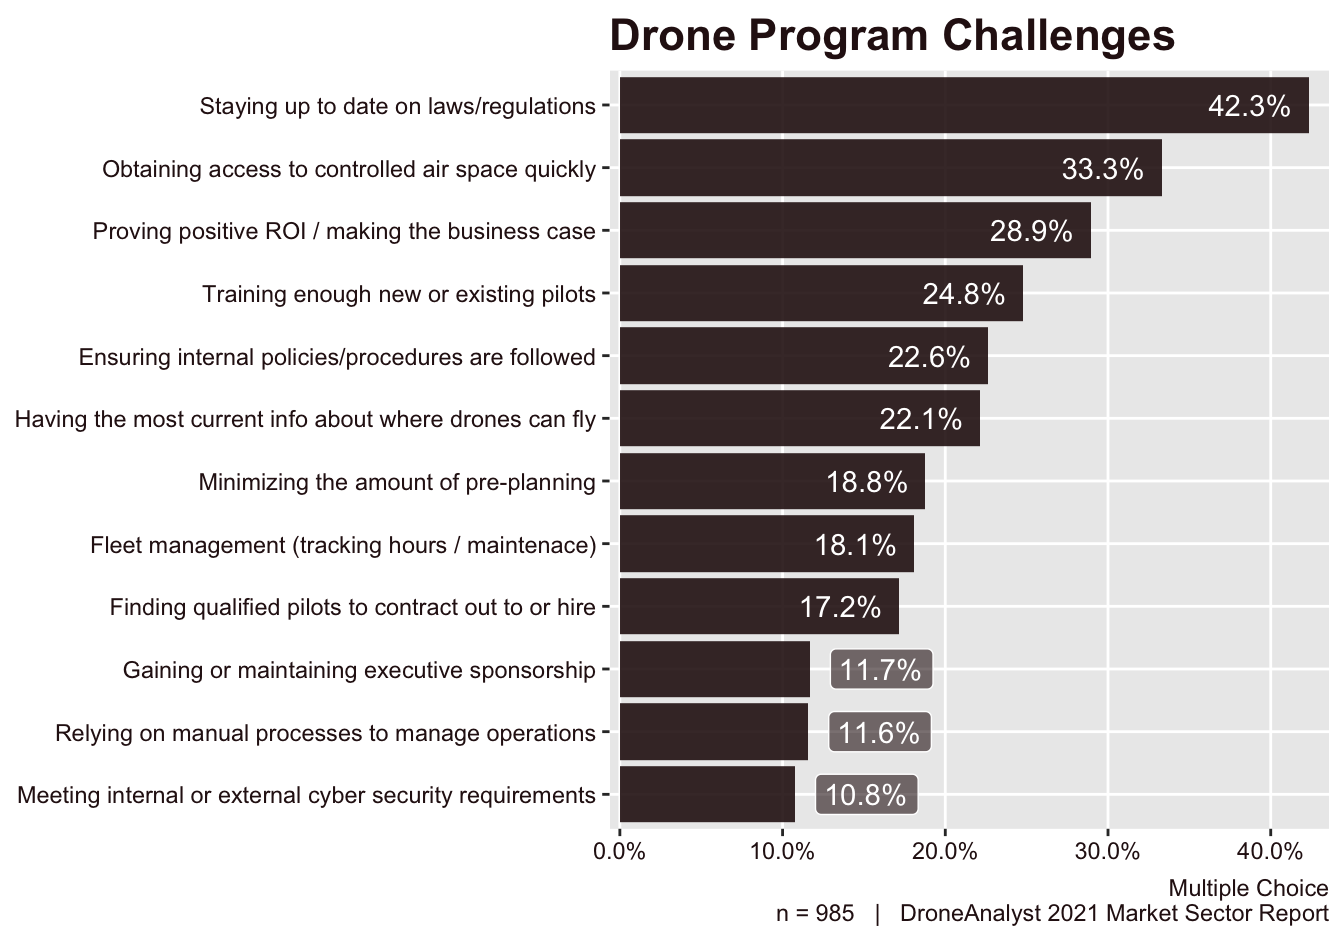
Each year we ask business and agency users about challenges that are inhibiting the growth of their drone program. We provide a list of common challenges and allow respondents to choose any number of options.
Challenges related to regulatory limits and knowledge have continually been top challenges for drone operations, which is seen even today in 2021 in the top two challenges. These top challenges are followed by more traditional challenges for a new technology such as proving ROI and training.
It’s also interesting to see that 25% of respondents list training enough new or existing pilots as a key challenge, when we saw most businesses opt for low-cost training options (Figure 5.13).
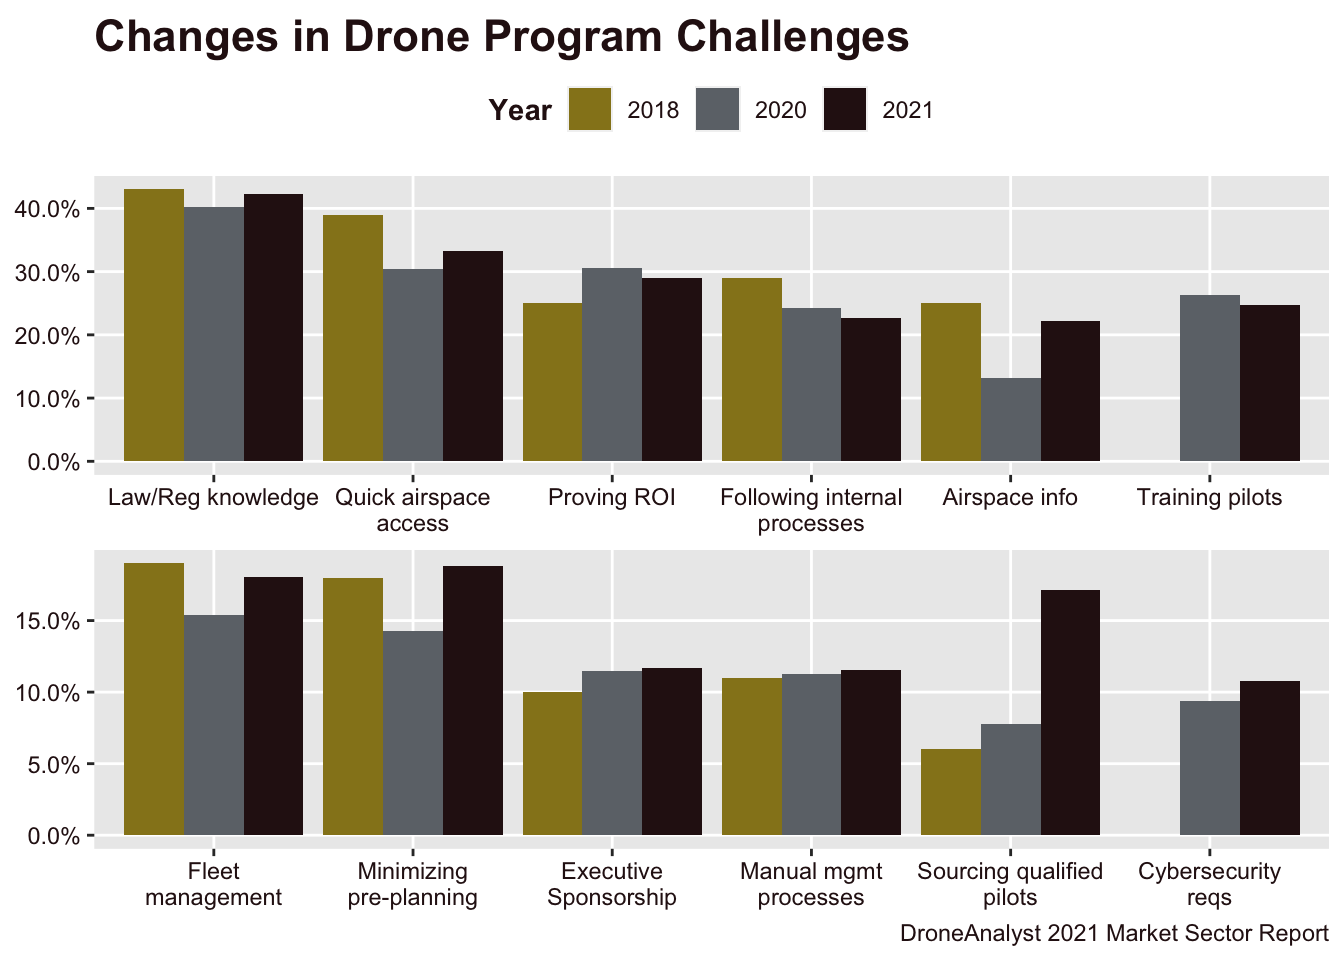
These challenges are also critical to look at from a historical angle, so we have broken out these findings going all the way back to 2018 in Figure 5.23 below. It’s important to note that we added two categories in 2020 (on training and cybersecurity) which were not included in 2018.
When viewed from a historical perspective, we are seeing a few categories like being informed about airspace information and getting access to airspace quickly slowly decrease, we haven’t seen any challenge really disappear.
On the upwardly trending challenges, it is interesting to see sourcing qualified pilots shoot up in 2021, moving from being a challenge for just 6% of drone programs in 2018 to 17% today. This may be related to struggles in the service provider market, where many newcomers entered the market to leave in recent years. Or it could also reflect the fact that a pilot may be expected to have both flying and camera skills in addition to industry-specific domain knowledge. Finding people who are experts in both areas can be hard when both areas don’t have defined training programs.
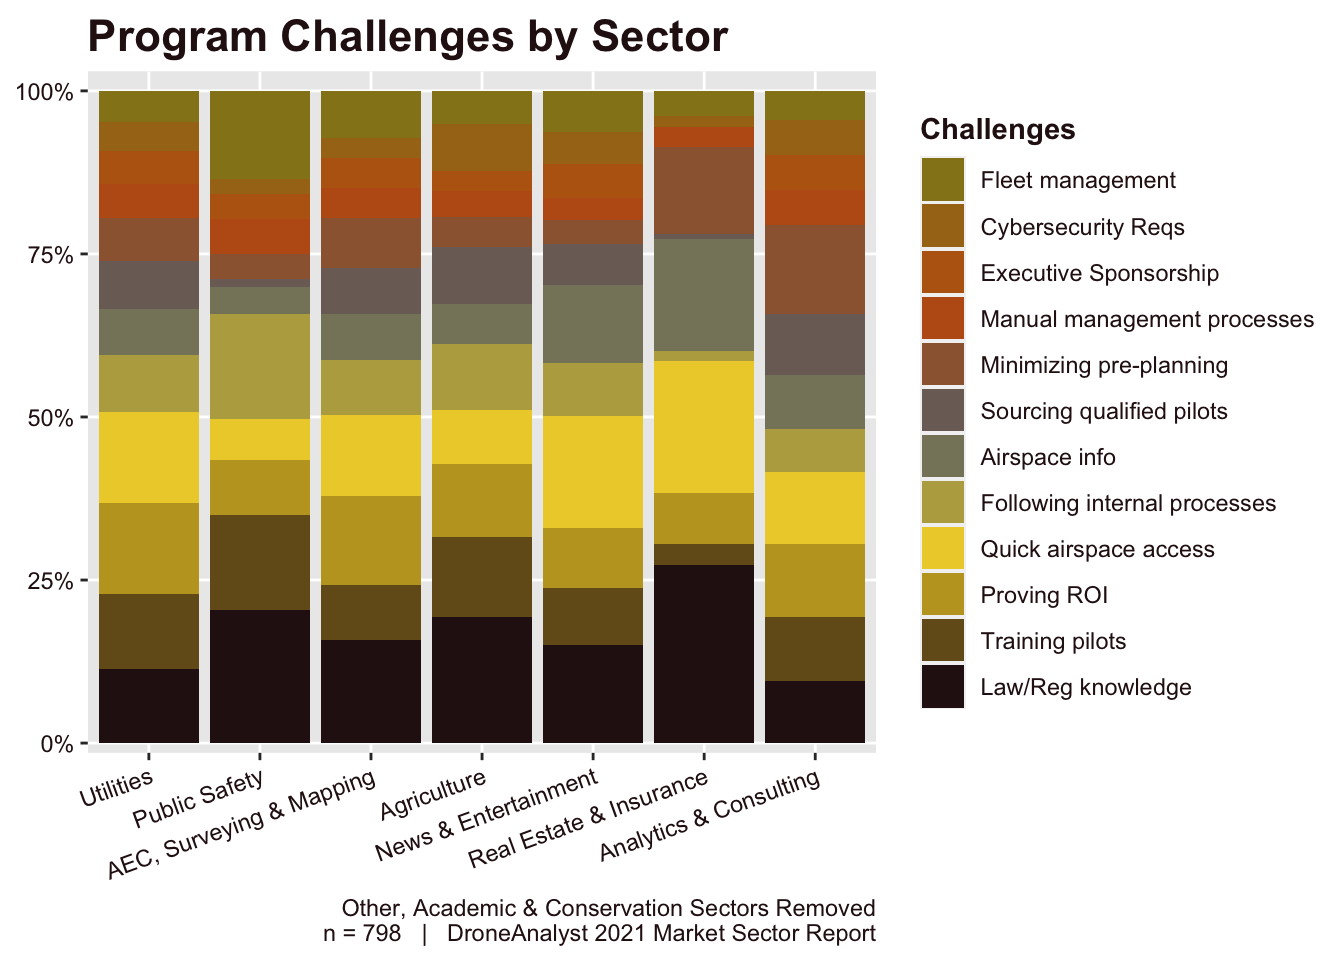
Lastly, we wanted to explore how these challenges vary across various sectors. This figure is by far our “messiest” of the report. In conversations with a few stakeholders, they have sought this information as a key way to understand the painpoint across verticals, for future product development and for marketing purposes. We have included this figure for a deeper analysis as it can show how the needs differ across sectors, but won’t spend too much time to discuss it, as this chart itself could be broken out and discussed about in countless ways.
Adoption and Benefits of Automation/Autonomy
This year we added a series of questions related to the adoption and benefits of autonomy. While we see much attention paid to the benefits of flight autonomy, it’s important for industry stakeholders and customers to know that they should care about autonomy across their entire drone stack, from data capture to acting on that data.
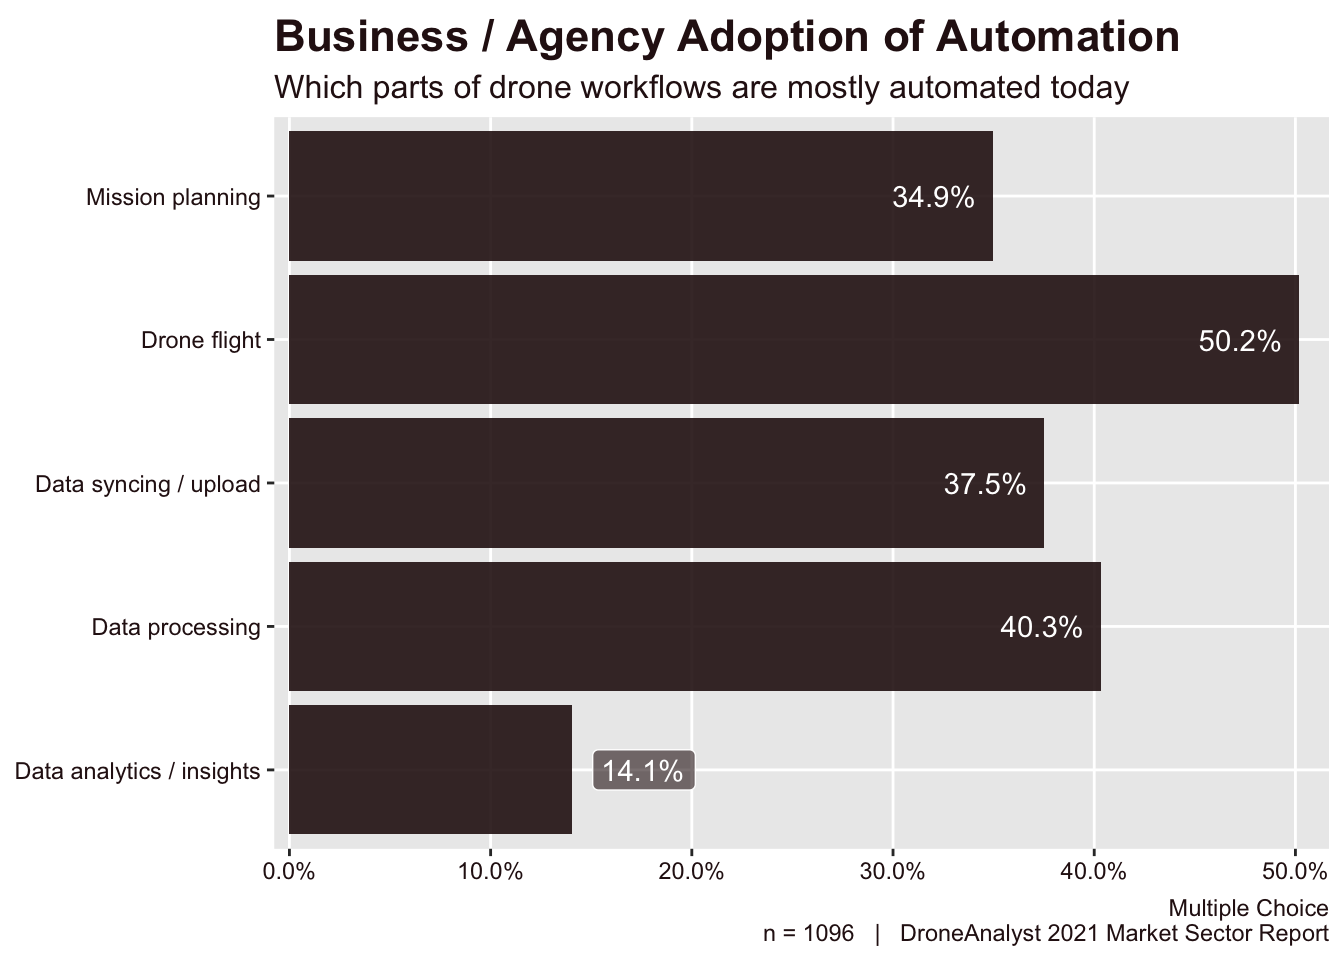
We began by asking customers about which aspects of their drone workflows were automated. This is a helpful way to understand both how customers see their workflows being automated and what they find most important to automate based off of their actions. The results are displayed below in Figure 5.25.
As you would expect, drone flight was the most automated aspect of business and agency workflows, being selected by half of all respondents. This was followed by data processing, which tends to be automated through photogrammetry software. It is interesting to see that this 40% figure is just below the attachment rate of insights and analytics software among business and agency users (Table 7.1).
The automation of data syncing / upload will likely rise in coming years as drones become increasingly connected through embedded cellular chips, as we are seeing with the Parrot Anafi Ai. Automation of mission planning has been fairly standard for years, as mapping missions can be easily automated through grid flight plans. More complex missions like inspection missions still tend to be automated only for specific types of flights, so we can expect to see more innovation in that area of the market.
Lastly, we see data analytics / insights as the least automated aspect of the drone workflow, being automated by only 14% of the market. This reflects the complexity of getting to the promise of AI / Machine Learning insights, as they tend to require the full stack to be automated before you can get consistent enough data for such automation to provide true value.
However, we are seeing some unique solutions, like DroneDeploy’s Stand Assessment function, that have achieved automation on the analytics side for industry-specific workflows. As insights and analytics software moves towards this trend, we will likely see automation increase further here.
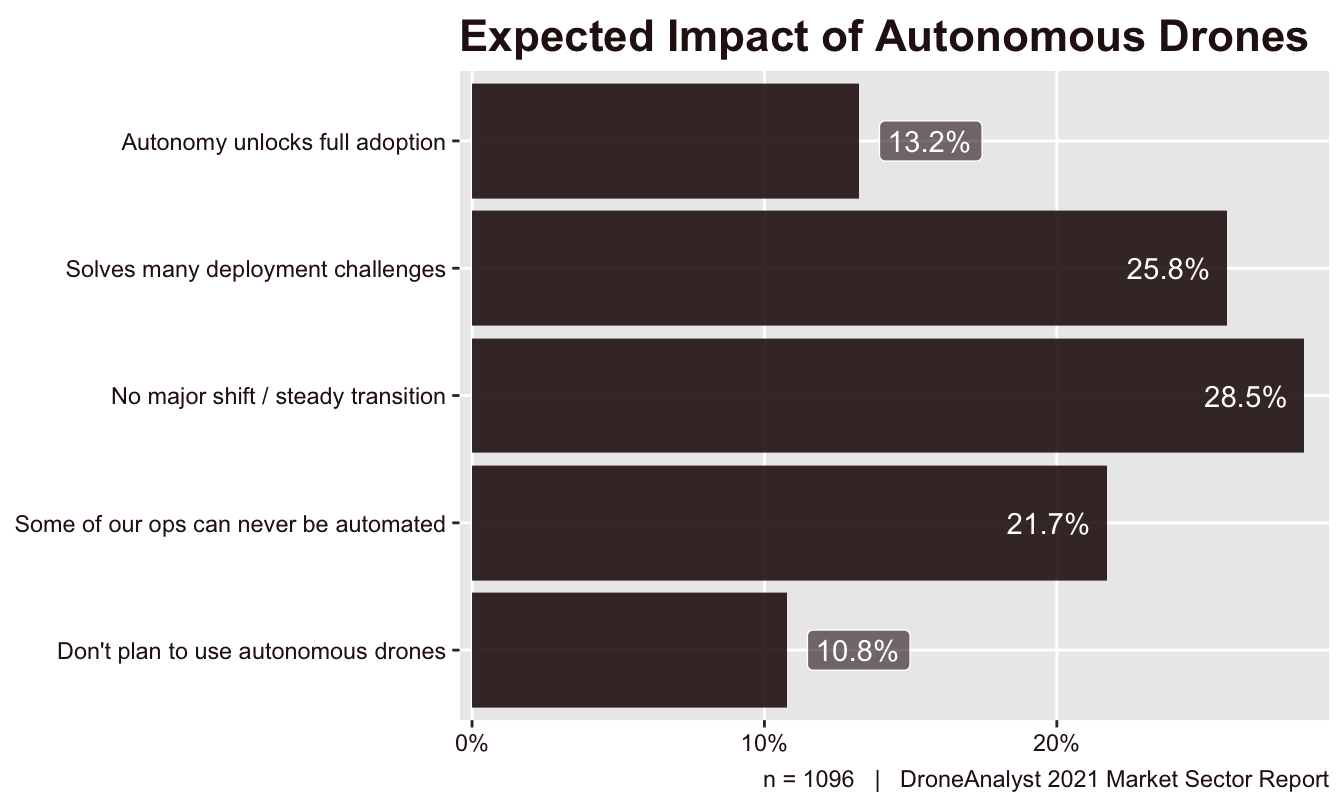
We also wanted to understand business and agency views on the benefits of autonomy in the future, so we asked respondents directly. The question provided 5 options that ranged “we don’t plan to use autonomous drone solutions” to “our organization is waiting for autonomous solutions to fully adopt drones”. The exact options have been shortened for readability, and are displayed below in Figure 5.26.
The options range from more positive opinions on the impacts of autonomous solutions at the top, to more restrained views at the bottom. The most selected option at 29% of respondents was that “we don’t expect a major shift to our usage of drones, but a steady transition”, followed closely by “autonomous solutions will solve many of our challenges in deploying drones” with 26% of respondents.
If we consider the no major shift option as the neutral choice, business and agency users generally had more positive and progressive views on the impact of autonomous drone solutions, at 39% positive vs 33% restrained.
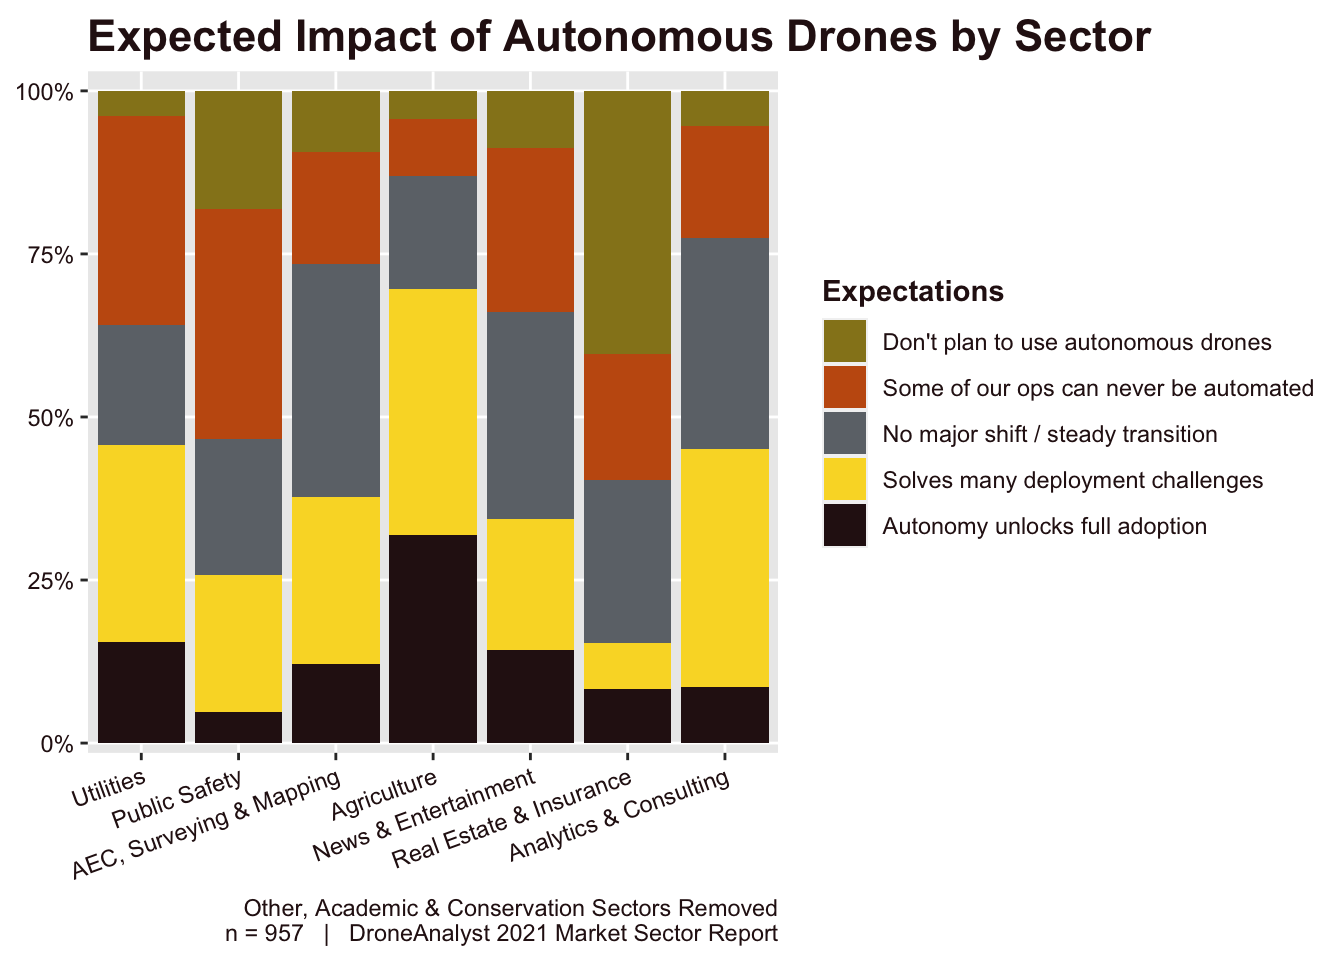
There is variation in the benefits across different sectors, as some industries have economic trends that would favor or even require autonomous solutions while others may require more creative usage that cannot realistically be fully automated away. We explore this breakdown further in Figure 5.27.
The key categories to watch here are that ops can never be automated (orange) and that autonomy solves many deployment challenges (yellow). You can see that Agriculture is far and away the sector that most sees autonomy as not just key to addressing challenges, but necessary for full adoption. This makes sense considering the labor shortages in this market, and the move to other automated systems like sprinklers, tractors and more, which would benefit from drone data. Additionally, users in the agriculture industry were least likely to say that some operations can never be automated.
Utilities, AEC and analytics sectors had similarly high levels of expectations for autonomy, although there is a notable dropoff of organizations that saw autonomy as critical to unlock full adoption when compared to the agricultural sector. Out of these three sectors, Utilities had a higher rate of firms noting that some operations can never be automated, which is likely to tie into more complex and detailed inspection missions.
Public safety agencies were comparably not as excited about autonomous solutions, with just 25% of these agencies having overly positive opinions and roughly 50% having more restrained views. This makes sense when considering that public safety work is often done in highly dynamic, complex and time-constrained environments that aren’t predictable. So while certain aspects of the workflow may be completely automated or highly automated, it isn’t surprising opinions here are more restrained.
Use of Other Robotics
This year we added one last question to this section to better understand how business and agency users who have adopted drones are approaching other robotic domains. We have long predicted that drones may be the first unmanned product that industrial firms adopt, and could be a gateway for broader adoption of unmanned systems.
While this trend is logical, it is important for brands, investors and other industry stakeholders to watch this space closely as it will lead to additional growth opportunities. Data capture should eventually be platform and domain agnostic, with manufacturers, software vendors, service providers and distributors offering solutions that address broad data capture needs, instead of focusing solely on the aerial robotic form factor.
We have seen this with pioneer firms like DroneDeploy, who partnered with Boston Dynamics on Spot in 2020 and has since acquired a ground robotic software firm, and RMUS, who has long included unmanned systems in their name and has recently started distributing Spot.
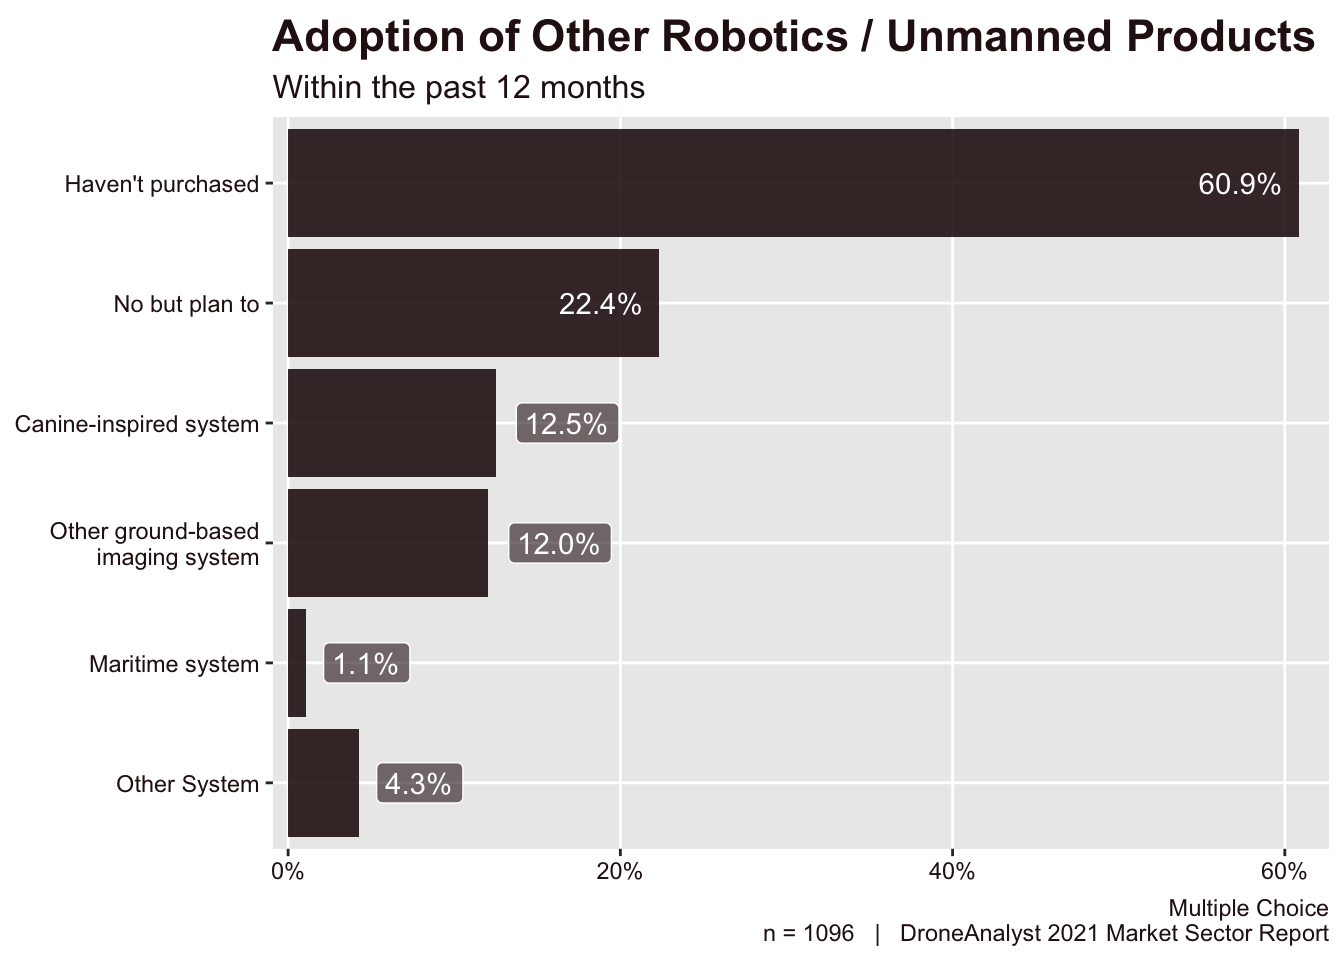
Our question related to other robotic domains asked whether or not their business had purchased any other robotic or unmanned product in the past 12 months. Business and agency users could select two negative options (no and no, but plan to) or three affirmative options that had a specific category of robotic systems (canine-inspired, other ground robot or maritime). If a respondent had purchased a system outside of the options we provided, there was an other option which allowed write-ins. The results from this questions are visualized below in Figure 5.28.
Overall, adoption of other robotic systems and products is fairly low, with 83% of respondents selecting that they haven’t purchased another system. 27% of these firms that haven’t purchased another robotic system have plans to do so in the future.
The remaining 17% of respondents who purchased another robotic system had primarily stuck to ground-based systems.
While this 17% figure may seem low initially, the fact that 39% of business and agency users have already purchased or have plans to purchase another robotic or unmanned system itself signifies that there is significant overlap among drone users and other robotic devices.
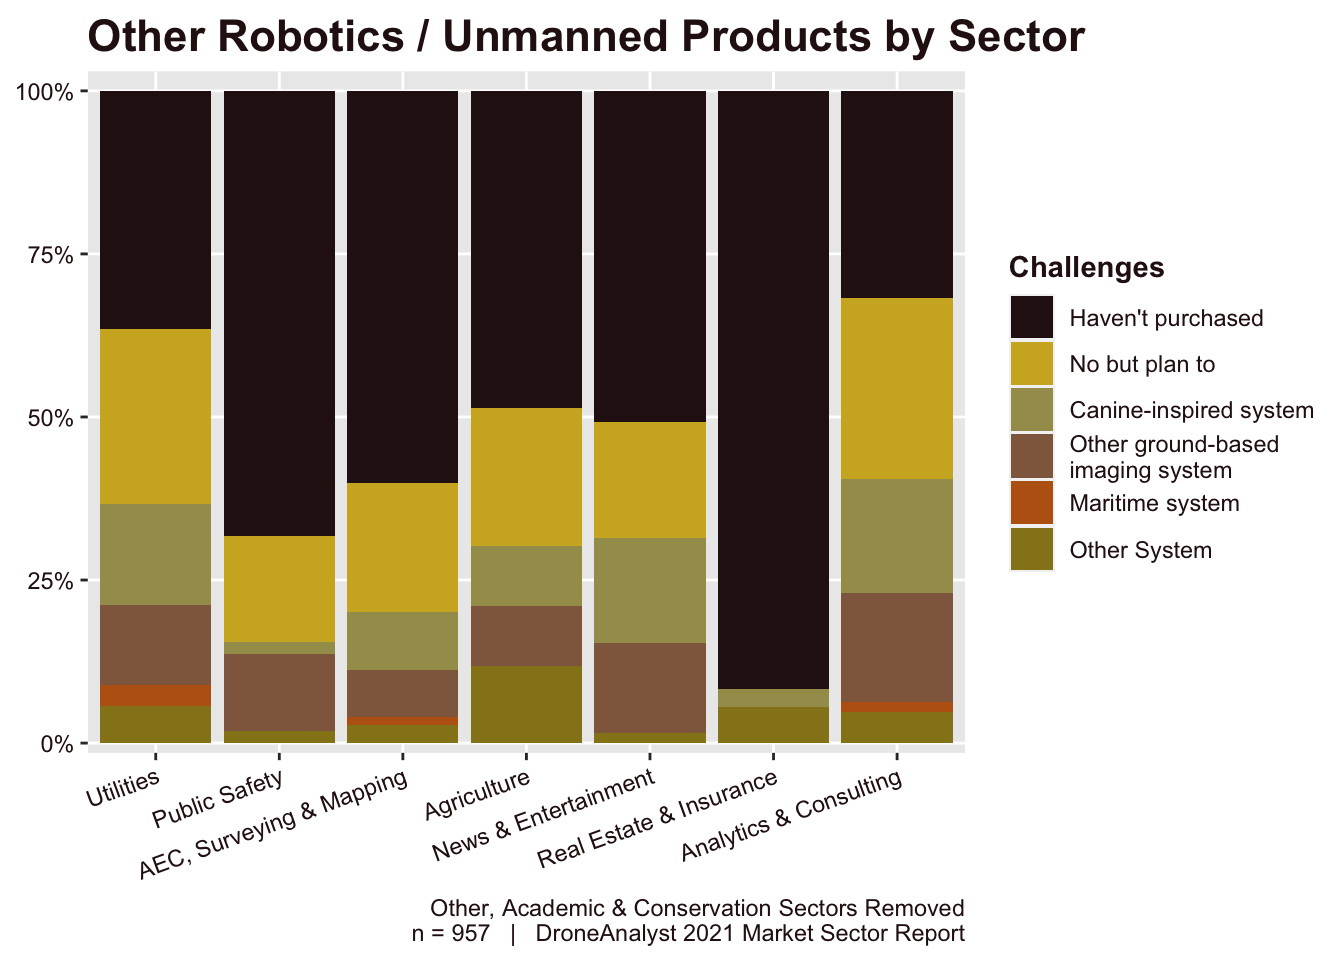
Certainly the benefits and usage of other robotics will vary greatly across sectors. To better understand exactly how much this varies by sector, we split out the sectors below in Figure 5.29.
When looked at through this by sector view, we can better understand which types of organizations are early investors in other robotics technologies. Utilities and analytics firms are far and away the most proactive, having over 60% of users purchased or plan to purchase another robotic system, and over 30% have already made a purchase.
Public safety agencies are an interesting outlier, with only a small fraction of these agencies already having invested in another robotic system, without significantly tapping into the canine-inspired system. While we have seen some distributors, like FLYMOTION, that are both heavily invested in the public safety market while carrying the canine-inspired Spot, often these products are out of the range of most local and state agencies. Whereas drones have mostly evolved from consumer products, these other forms are industrial-first, which may slow adoption among fairly disperse industries like public safety (and to a lesser extent, construction).
Real estate and insurance is the largest outlier, with nearly 0 adoption or purchasing intent. This makes sense considering both that these firms tend to be quite small, and the need for data collection for marketing purposes is nearly completely fulfilled by aerial drones.