About the Report
This is our fifth industry benchmark report, and it is our most comprehensive study of drone market trends and usage to date. This year’s research uncovers fresh insights on which industry players are thriving (and which aren’t) and how businesses are using drone-acquired data in their day-to-day operations. We believe this report fills a gap in knowledge and understanding of the commercial drone industry concerning:
Who’s buying what types of drones from which makers at what prices and for what uses.
How large the drone-based service providers are, and how they position themselves to their target industries.
Who the business users of drone-based projects are, which industries have traction and how much is being spent on drone services.
How much service providers, business users, and public agencies are using operations management and insights/analytics software for drone-based projects.
How the various market players have been impacted by rising US-China trade tensions,speculation around the security of drone products and the COVID-19 pandemic.
Data collected for this study comes from a survey we conducted over the web in June and July 2021, as well as interviews with companies and agencies throughout 2021. The study evaluates four distinct segments of the market:
Drone Aircraft and Payload Purchases
Business and Public Agency Users
Service Providers
Software Apps and Services
Our online survey garnered over 1,500 responses representing 39 industries across 110 countries.
Our analysis yielded 10 key insights that summarize the current state of the four segments, as well as overall market growth and drone use by industry.
This year we have added additional figures and data points to better communicate how survey responses varied across different sectors and regions.
The report includes 91 figures, 4 tables, and an appendix listing our survey questions. This is a significant expansion from our 67 figures in 2020, and fewer in the years before.
How to Read this Report
As our analysis has gotten deeper, we have also made some slight adjustments to the structure of the report to make it easier to consume and navigate. Additionally, you will likely note that this report is now also available in a secured online format. This opens up additional linking, searching and navigation possibilities that weren’t possible before.
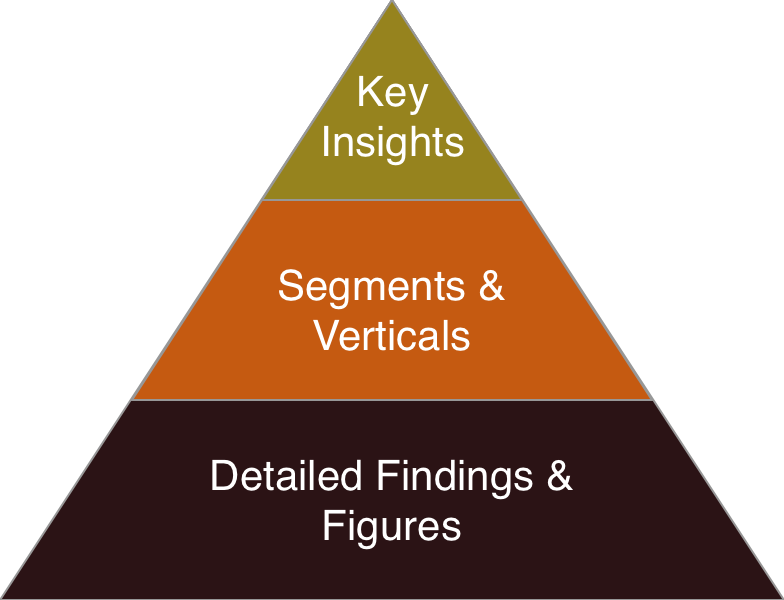
The report is divided into three core sections - 2 Key Insights, 3 Understanding Segments and Verticals and 4 Detailed Findings and Figures (dispersed across sections 4-7). These three core components fit together like a pyramid, with the most detail at the bottom and the most relevant conclusions at the top (see figure below for reference).
This reading path is meant for the average and first-time consumer of the report, but we suggest different folks take different paths. Generally speaking, for those who have read our previous annual reports, we suggest skimming the Key Insights then going directly to the Detailed Findings section and going figure by figure.
The Detailed Findings (#s 4-7)section presents the results and analyses from each survey question. It contains all the figures and tables. It is organized to match our survey, with four sections that correspond to the four major segments of the drone industry. They are listed below and can also be found through the table of contents/navigation tab to the left:
4 Drone Aircraft and Payload Purchases
5 Business and Agency Users
6 Service Providers
7 Software Services
The Understanding Segments and Verticals (3)section summarizes and analyzes the detailed findings for each of the four industry segments. It also includes the results from our industry interviews.
The Key Insights (2) section provides the 10 most significant industry insights we gleaned from our detailed analysis and interviews.
Each section of the report is accessible through the tab on the left, and sections with figures and tables will include a linked list of figures/tables. You will also be able to directly navigate to sub-components of each section through this navigation pane.
Lastly, it is important for you to read and understand the demographics behind our survey in our first numbered section (and the next major section of the report), Demographics (1) . This section runs through the demographics and demographic changes behind our survey data. You can access the next section through the left navigation pane or click the arrows on the sides of this page itself.
Reading our Figures
Each of our figures includes a few key textual elements in the bottom-right footer which are important to pay attention to, these include:
Sample size (n): this is included dynamically for each figure in our report and refers to the amount of unique respondents who contributed to the data of a specific figure. This helps provide more context to the reliability of each figure and the trade-off between more nuanced/segmented datapoints and accuracy of findings. Sample size is included on all figures except figures that compare trends across multiple years.
Multiple Choice: some of our survey questions are multiple choice questions where users can select one or several different options. At times, respondents can even write in multiple Other selections (we instruct them how to do this so it is readable, then automatically parse out these and combine various spellings). As we calculate percentages on graphs based on individual responses, instead of relative responses per graph, the total sum of each option on a figure will add up to above 100%. For clarity, we mark all such figures where the question is multiple choice as such.
Sub-groups/filtered data: each section of our report relies on specific, qualified responses for that section, with notices about the breakdown by industry/sector at the beginning of the section. For some figures or data points, we further segment the respondents to unveil interesting insights. In such situations, we will mention the limitations or exclusions at the bottom right of the figure, and the sample size market will dynamically change to reflect this as well.
An example of what this looks like is provided below.